

Question: Please help with finding the p-values, average % difference, and standard deviation. O ZOOM + Day 21 Day 21 Test Group Height Height % Diff
Please help with finding the p-values, average % difference, and standard deviation.
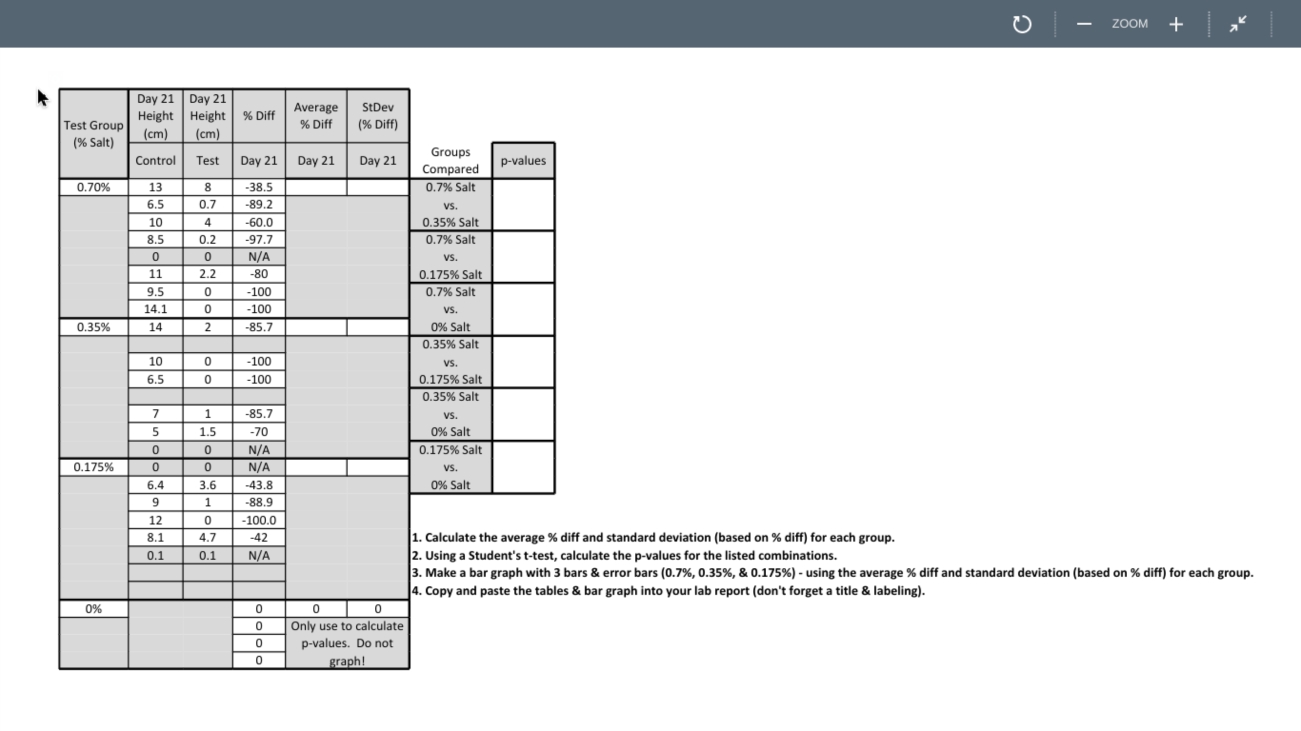
O ZOOM + Day 21 Day 21 Test Group Height Height % Diff Average StDev (% Diff) (% Salt) (cm) (cm) % Diff Control Test Day 21 Day 21 Day 21 Groups Compared p-values 0.70% 13 8 -38.5 0.7% Salt 6.5 0.7 -89.2 VS. 10 4 -60.0 0.35% Salt 8.5 0.2 -97.7 0.7% Salt 0 0 N/A VS. 11 2.2 -80 0.175% Salt 9.5 0 -100 0.7% Salt 14.1 0 .100 VS. 0.35% 14 2 -85.7 0% Salt 0.35% Salt 10 0 -100 VS. 6.5 0 -100 0.175% Salt 0.35% Salt 7 1 -85.7 VS. 5 1.5 -70 0% Salt 0 0 N/A 0.175% Salt 0.175% 0 0 N/A VS. 6.4 3.6 -43.8 0% Salt 9 1 -88.9 12 0 -100.0 8.1 4.7 -42 0.1 0.1 N/A 1. Calculate the average % diff and standard deviation (based on % diff) for each group. 2. Using a Student's t-test, calculate the p-values for the listed combinations. 3. Make a bar graph with 3 bars & error bars (0.7%, 0.35%, & 0.175%) - using the average % diff and standard deviation (based on % diff) for each group. 0% 0 0 0 4. Copy and paste the tables & bar graph into your lab report (don't forget a title & labeling). O Only use to calculate 0 p-values. Do not 0 graph
Step by Step Solution
There are 3 Steps involved in it

Get step-by-step solutions from verified subject matter experts