

Question: Please help with following steps for part 1! are two parts to this assignment: Part 1: In the Microsoft Excel file on the Ratio template
Please help with following steps for part 1!
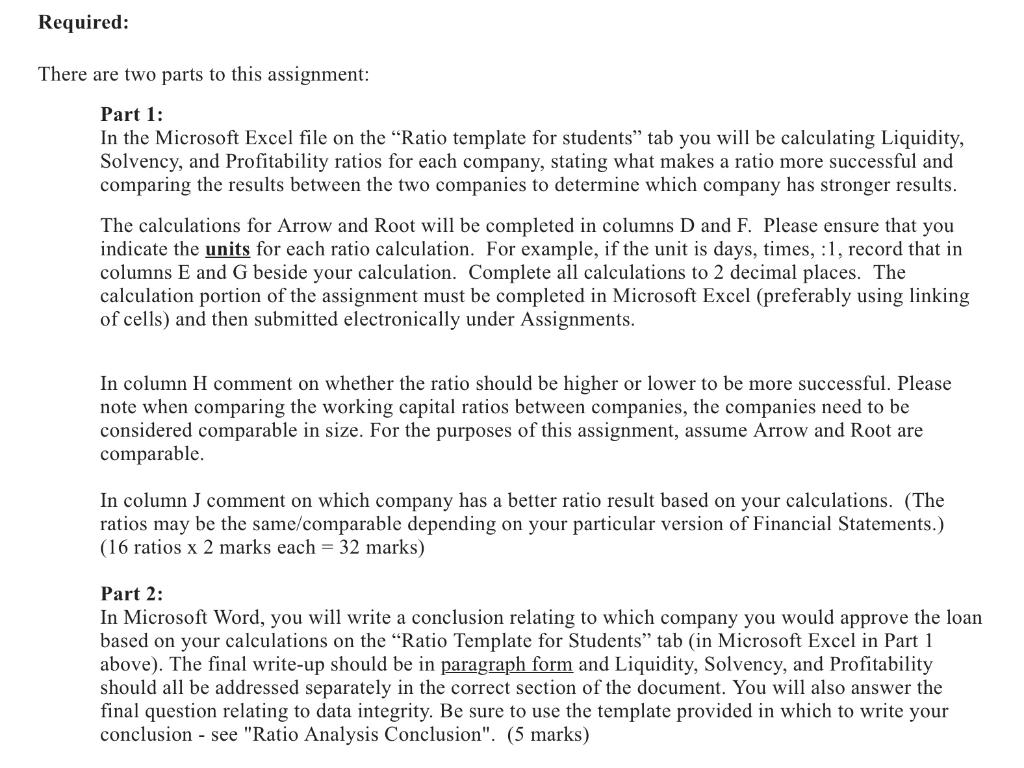
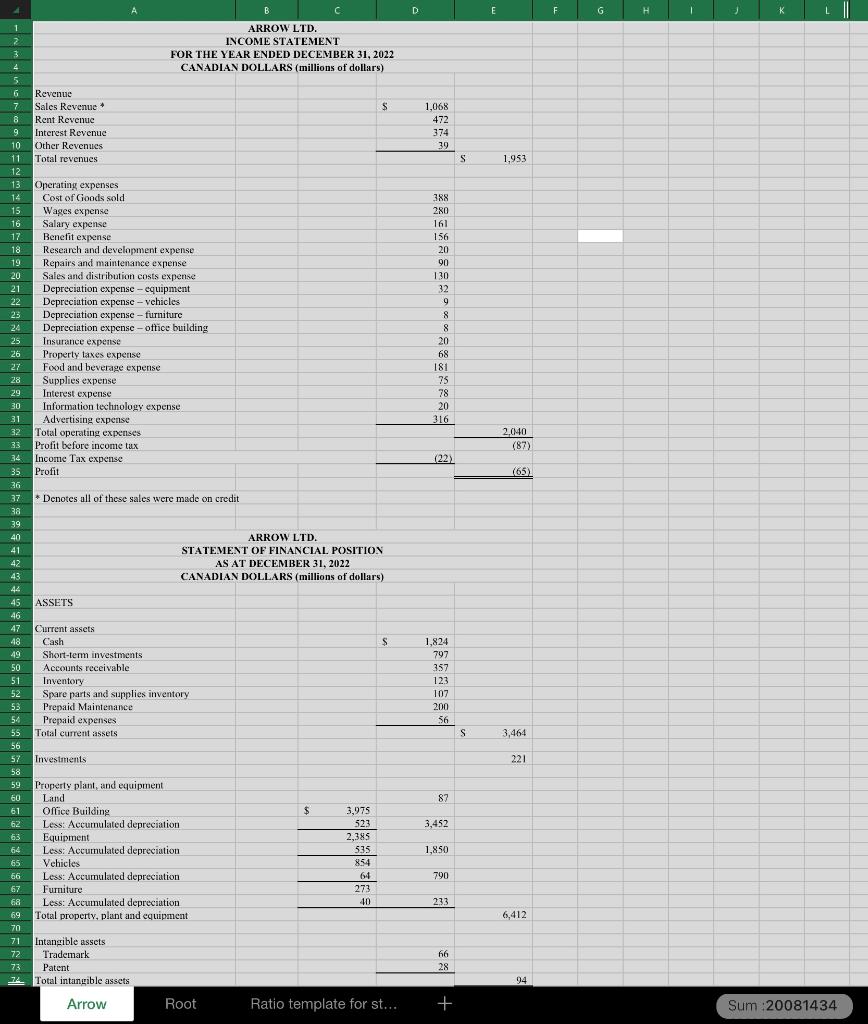
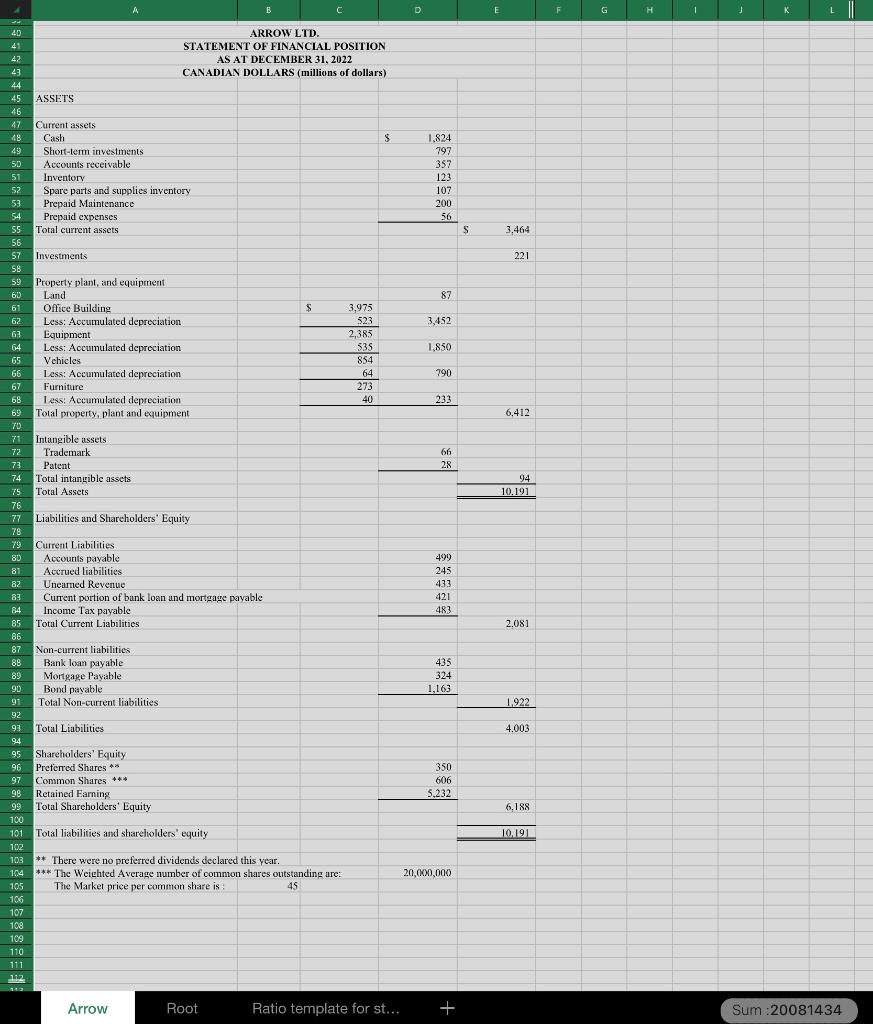
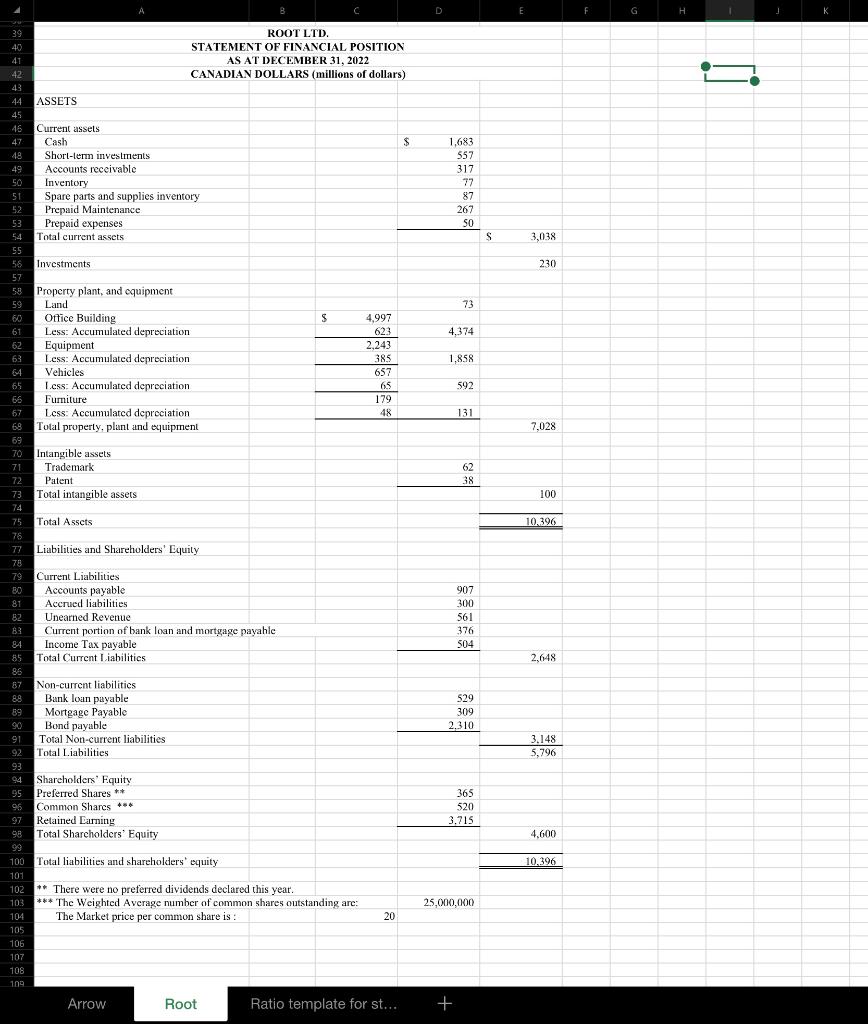
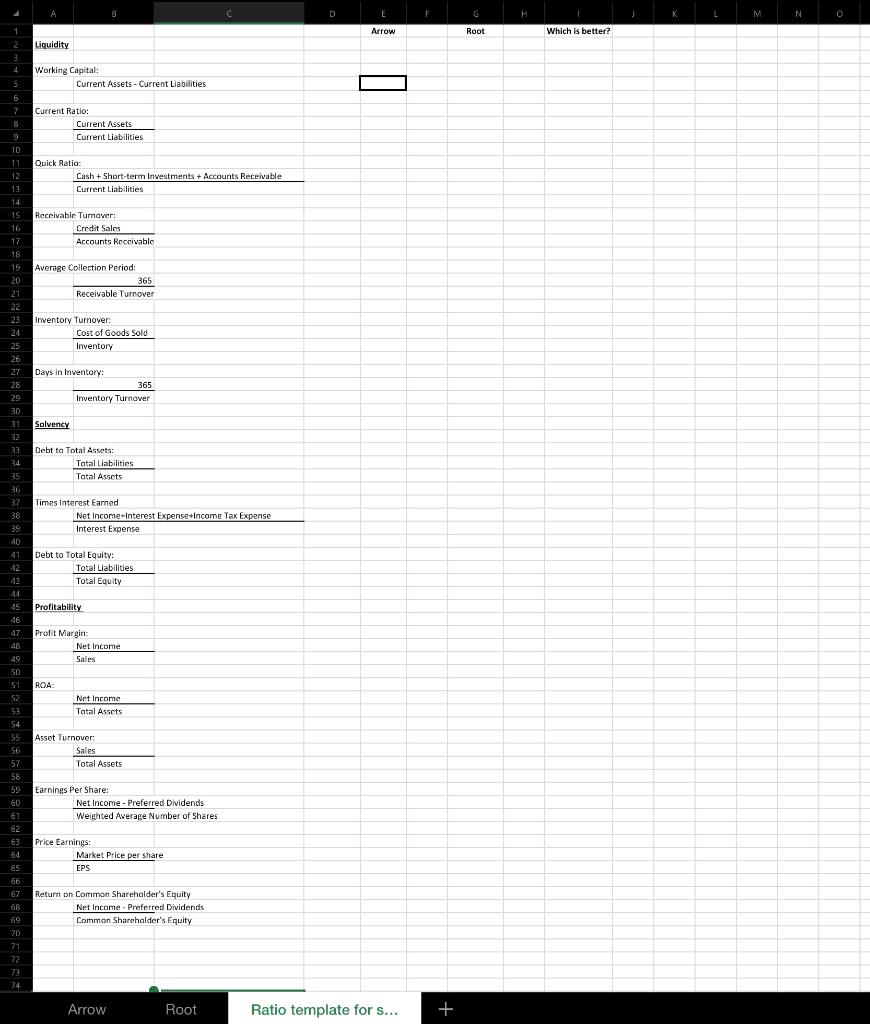
are two parts to this assignment: Part 1: In the Microsoft Excel file on the "Ratio template for students" tab you will be calculating Liquidity, Solvency, and Profitability ratios for each company, stating what makes a ratio more successful and comparing the results between the two companies to determine which company has stronger results. The calculations for Arrow and Root will be completed in columns D and F. Please ensure that you indicate the units for each ratio calculation. For example, if the unit is days, times, :1, record that in columns E and G beside your calculation. Complete all calculations to 2 decimal places. The calculation portion of the assignment must be completed in Microsoft Excel (preferably using linking of cells) and then submitted electronically under Assignments. In column H comment on whether the ratio should be higher or lower to be more successful. Please note when comparing the working capital ratios between companies, the companies need to be considered comparable in size. For the purposes of this assignment, assume Arrow and Root are comparable. In column J comment on which company has a better ratio result based on your calculations. (The ratios may be the same/comparable depending on your particular version of Financial Statements.) (16 ratios 2 marks each =32 marks) Part 2: In Microsoft Word, you will write a conclusion relating to which company you would approve the loan based on your calculations on the "Ratio Template for Students" tab (in Microsoft Excel in Part 1 above). The final write-up should be in paragraph form and Liquidity, Solvency, and Profitability should all be addressed separately in the correct section of the document. You will also answer the final question relating to data integrity. Be sure to use the template provided in which to write your conclusion - see "Ratio Analysis Conclusion". (5 marks) ARROW LTD. INCOME STATEMENT FOR THE YEAR ENDED DECEMBER 31, 2022 CANADIAN DOLLARS (millions of dollars) Revenue Sales Revenue * Rent Revenue Interest Revenue Other Revenues Total revenues \begin{tabular}{rr|r|} \hline$ & 1,068 & \\ & 472 & \\ \hline 374 & & \\ \hline & 39 \\ \hline & & \\ \hline \end{tabular} Onerating expenses Cost of Goods sold Wages expense Salary expense Benefit expense Research and development expense Repairs and maintenance expense Sales and distribution costs expense Depreciation expense - equipment Depreciation expense - vehicles Depreciation expense - furniture Depreciation expense - oftice building Insurance expense Property laxes expense Food and beverage expense Supplies expense Interest expense Information techuology expense Advertising expense Total operating expenses Profit before income tax Income Tax expense Profit \begin{tabular}{r|r|} \hline 388 \\ 280 \\ 161 \\ 156 \\ 20 \\ 90 \\ 130 \\ 32 \\ 9 & \\ 8 & \\ 8 & \\ 20 & \\ 68 & \\ 181 & \\ 75 & \\ 78 & \\ 20 & \\ 316 \\ \hline \end{tabular} * Denotes all of these sales were made on credit ARROW LTD. STATEMENT OF FINANCLAL POSITION AS AT DECEMBER 31, 2022 CANADIAN DOLLARS (millions of dollars) ASSETS Current assets Cash Short-term investments Accounts receivable Inventory Spare parts and supplies inventory Prepaid Maintenance Prepaid expenses Total current assets Investments Property plant, and equipment Land Office Building Less: Accumulated depreciation Equipment Less: Accumulated depreciation Vehicles Less: Accumulated depreciation Fumiture Less: Accumulated depreciation Total property, plant and equipment Intangible assets Trademark Patent Total intangible assets ARROW LTD. STATEMENT OF FINANCIAL POSITION AS AT DECEMBER 31, 2022 CANADIAN DOLLARS (millions of dollars) ASSETS Current assets Property plant, and equipment Land Office Building Less: Accumulated depreciation Equipment Less: Accumulated depreciation Vehicles Less: Accumulated depreciation Furniture Less: Accumulated depreciation Total property, plant and equipment Intangible assets Trademark Patent Total intanyible assets Total Assets Liabilities and Sharcholders' Equity Current Liabilities Accounts payable Accrued liabilities Unearned Revenue Current portion of bunk loan and mortgage payable Income Tax payable Total Current Liabilities Non-current liabilities Bank loan payable Morgage Payable Bond payable Total Non-current liabilities Total Liabilities Shareholders' Equity Preferred Shares 4% Common Shares *** Retained Farning Total Shareholders' Equity Total liabilities and shareholders' equity There were no preferred dividends declared this year. *** The Weighted Average number of common shares outstanding are: 20,000,000 The Market price per common share is : 45 A B C E G ROOT LTD. INCOME STATEMENT FOR THE YEAR ENDED DECEMBER 31,2022 CANADIAN DOI.I.ARS (millions of dollars) Revenue Sales Revenue * Rent Revenue \begin{tabular}{rr|r|} \multicolumn{1}{r|}{$1,144} \\ & 570 \\ & \\ & 233 & \\ & 59 & \\ \hline & $ & 2,006 \\ \hline \end{tabular} Interest Revenue Other Revenues Total revenues Operating expenses Cost of Goods sold Wages expense Salary expense Benefit expense Research and development expense Repairs and maintenance expense Sales and distribution costs expense Depreciation expense - equipment Depreciation expense - vehicles Depreciation expense - furniture Depreciation expense - office building Insurance expense Property taxes expense Food and beverage expense Supplies expense Interest expense Information technology expense Advertising expense Total operating expenses Profit before income tax Income Tax expense Profit 369 * Denotes all of these sales were made on credit ROOT LTD. STATEMENT OF FINANCIAL POSITION AS AT DECEMBER 31, 2022 CANADIAN DOLLARS (millions of dollars) ASSETS Current assets Cash Short-term investments Accounts receivable Inventory Spare parts and supplies inventory Prepaid Maintenance Prepaid expenses Total current assets 256 192 H 1 I A B c E G H K ROOT LTD. STATEMENT OF FINANCIAL POSITION AS AT DECEMBER 31, 2022 CANADIAN DOLLARS (millions of dollars) ASSETS Current assets Cash Shorl-term investments Accounts receivable Inventory Spare parts and supplies inventory Prepaid Maintenance Prepaid expenses Total current assets Investments Property plant, and equipment Land Otfice Building Less: Accumulated depreciation Equipment Less: Accumulated depreciation Vehicles I.css: Accumulared depreciation Fumiture Less: Accumulared depreciation Total property, plant and equipment Intangible assets Trademark Patent Total intangible assets Total Assets Liabilities and Shareholders' Equily Current Liabilities Accounts payable Accrued liabilities Unearned Revenue Current portion of bank loan and mortgage payahle Income Tax payable Total Current I.iabilities \begin{tabular}{|r|r|} \hline 907 & \\ \hline 300 & \\ \hline 561 & \\ \hline 376 & \\ \hline 504 & \\ \hline & \\ \hline 5,648 \\ \hline 309 & \\ \hline 2,310 & \\ \hline \end{tabular} Non-current liabilitics Bank loan payable Mortgage Payable Bond payable Total Non-current liabilities Total Liabilities Shareholders' Fquity Preferred Shares ** Common Shares Retained Earning Total Sharcholders' Equity Total liabilities and shareholders' equity ** There were no preferred dividends declared this year. *** The Weighted Average number of common shares outstanding are: The Market price per common share is : 20 are two parts to this assignment: Part 1: In the Microsoft Excel file on the "Ratio template for students" tab you will be calculating Liquidity, Solvency, and Profitability ratios for each company, stating what makes a ratio more successful and comparing the results between the two companies to determine which company has stronger results. The calculations for Arrow and Root will be completed in columns D and F. Please ensure that you indicate the units for each ratio calculation. For example, if the unit is days, times, :1, record that in columns E and G beside your calculation. Complete all calculations to 2 decimal places. The calculation portion of the assignment must be completed in Microsoft Excel (preferably using linking of cells) and then submitted electronically under Assignments. In column H comment on whether the ratio should be higher or lower to be more successful. Please note when comparing the working capital ratios between companies, the companies need to be considered comparable in size. For the purposes of this assignment, assume Arrow and Root are comparable. In column J comment on which company has a better ratio result based on your calculations. (The ratios may be the same/comparable depending on your particular version of Financial Statements.) (16 ratios 2 marks each =32 marks) Part 2: In Microsoft Word, you will write a conclusion relating to which company you would approve the loan based on your calculations on the "Ratio Template for Students" tab (in Microsoft Excel in Part 1 above). The final write-up should be in paragraph form and Liquidity, Solvency, and Profitability should all be addressed separately in the correct section of the document. You will also answer the final question relating to data integrity. Be sure to use the template provided in which to write your conclusion - see "Ratio Analysis Conclusion". (5 marks) ARROW LTD. INCOME STATEMENT FOR THE YEAR ENDED DECEMBER 31, 2022 CANADIAN DOLLARS (millions of dollars) Revenue Sales Revenue * Rent Revenue Interest Revenue Other Revenues Total revenues \begin{tabular}{rr|r|} \hline$ & 1,068 & \\ & 472 & \\ \hline 374 & & \\ \hline & 39 \\ \hline & & \\ \hline \end{tabular} Onerating expenses Cost of Goods sold Wages expense Salary expense Benefit expense Research and development expense Repairs and maintenance expense Sales and distribution costs expense Depreciation expense - equipment Depreciation expense - vehicles Depreciation expense - furniture Depreciation expense - oftice building Insurance expense Property laxes expense Food and beverage expense Supplies expense Interest expense Information techuology expense Advertising expense Total operating expenses Profit before income tax Income Tax expense Profit \begin{tabular}{r|r|} \hline 388 \\ 280 \\ 161 \\ 156 \\ 20 \\ 90 \\ 130 \\ 32 \\ 9 & \\ 8 & \\ 8 & \\ 20 & \\ 68 & \\ 181 & \\ 75 & \\ 78 & \\ 20 & \\ 316 \\ \hline \end{tabular} * Denotes all of these sales were made on credit ARROW LTD. STATEMENT OF FINANCLAL POSITION AS AT DECEMBER 31, 2022 CANADIAN DOLLARS (millions of dollars) ASSETS Current assets Cash Short-term investments Accounts receivable Inventory Spare parts and supplies inventory Prepaid Maintenance Prepaid expenses Total current assets Investments Property plant, and equipment Land Office Building Less: Accumulated depreciation Equipment Less: Accumulated depreciation Vehicles Less: Accumulated depreciation Fumiture Less: Accumulated depreciation Total property, plant and equipment Intangible assets Trademark Patent Total intangible assets ARROW LTD. STATEMENT OF FINANCIAL POSITION AS AT DECEMBER 31, 2022 CANADIAN DOLLARS (millions of dollars) ASSETS Current assets Property plant, and equipment Land Office Building Less: Accumulated depreciation Equipment Less: Accumulated depreciation Vehicles Less: Accumulated depreciation Furniture Less: Accumulated depreciation Total property, plant and equipment Intangible assets Trademark Patent Total intanyible assets Total Assets Liabilities and Sharcholders' Equity Current Liabilities Accounts payable Accrued liabilities Unearned Revenue Current portion of bunk loan and mortgage payable Income Tax payable Total Current Liabilities Non-current liabilities Bank loan payable Morgage Payable Bond payable Total Non-current liabilities Total Liabilities Shareholders' Equity Preferred Shares 4% Common Shares *** Retained Farning Total Shareholders' Equity Total liabilities and shareholders' equity There were no preferred dividends declared this year. *** The Weighted Average number of common shares outstanding are: 20,000,000 The Market price per common share is : 45 A B C E G ROOT LTD. INCOME STATEMENT FOR THE YEAR ENDED DECEMBER 31,2022 CANADIAN DOI.I.ARS (millions of dollars) Revenue Sales Revenue * Rent Revenue \begin{tabular}{rr|r|} \multicolumn{1}{r|}{$1,144} \\ & 570 \\ & \\ & 233 & \\ & 59 & \\ \hline & $ & 2,006 \\ \hline \end{tabular} Interest Revenue Other Revenues Total revenues Operating expenses Cost of Goods sold Wages expense Salary expense Benefit expense Research and development expense Repairs and maintenance expense Sales and distribution costs expense Depreciation expense - equipment Depreciation expense - vehicles Depreciation expense - furniture Depreciation expense - office building Insurance expense Property taxes expense Food and beverage expense Supplies expense Interest expense Information technology expense Advertising expense Total operating expenses Profit before income tax Income Tax expense Profit 369 * Denotes all of these sales were made on credit ROOT LTD. STATEMENT OF FINANCIAL POSITION AS AT DECEMBER 31, 2022 CANADIAN DOLLARS (millions of dollars) ASSETS Current assets Cash Short-term investments Accounts receivable Inventory Spare parts and supplies inventory Prepaid Maintenance Prepaid expenses Total current assets 256 192 H 1 I A B c E G H K ROOT LTD. STATEMENT OF FINANCIAL POSITION AS AT DECEMBER 31, 2022 CANADIAN DOLLARS (millions of dollars) ASSETS Current assets Cash Shorl-term investments Accounts receivable Inventory Spare parts and supplies inventory Prepaid Maintenance Prepaid expenses Total current assets Investments Property plant, and equipment Land Otfice Building Less: Accumulated depreciation Equipment Less: Accumulated depreciation Vehicles I.css: Accumulared depreciation Fumiture Less: Accumulared depreciation Total property, plant and equipment Intangible assets Trademark Patent Total intangible assets Total Assets Liabilities and Shareholders' Equily Current Liabilities Accounts payable Accrued liabilities Unearned Revenue Current portion of bank loan and mortgage payahle Income Tax payable Total Current I.iabilities \begin{tabular}{|r|r|} \hline 907 & \\ \hline 300 & \\ \hline 561 & \\ \hline 376 & \\ \hline 504 & \\ \hline & \\ \hline 5,648 \\ \hline 309 & \\ \hline 2,310 & \\ \hline \end{tabular} Non-current liabilitics Bank loan payable Mortgage Payable Bond payable Total Non-current liabilities Total Liabilities Shareholders' Fquity Preferred Shares ** Common Shares Retained Earning Total Sharcholders' Equity Total liabilities and shareholders' equity ** There were no preferred dividends declared this year. *** The Weighted Average number of common shares outstanding are: The Market price per common share is : 20
Step by Step Solution
There are 3 Steps involved in it

Get step-by-step solutions from verified subject matter experts