

Question: Please help with formulas for excel sheet A B C D E F. G H J K L M N Analysis for Performance Tubes 1
 Please help with formulas for excel sheet
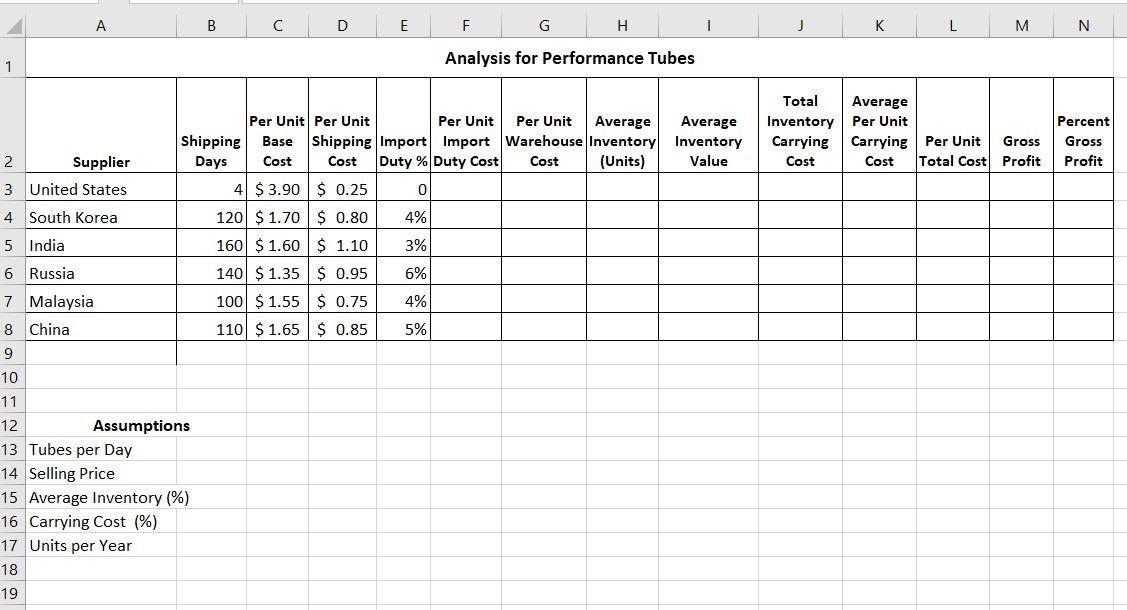
A B C D E F. G H J K L M N Analysis for Performance Tubes 1 Total Inventory Carrying Cost Average Per Unit Carrying Per Unit Gross Cost Total Cost Profit Percent Gross Profit Cost Per Unit Per Unit Per Unit Per Unit Average Average Shipping Base Shipping Import Import Warehouse Inventory Inventory 2 Supplier Days Cost Duty % Duty Cost Cost (Units) Value 3 United States 4 $ 3.90 $ 0.25 0 4 South Korea 120 $ 1.70 $ 0.80 4% 5 India 160 $ 1.60 $ 1.10 3% 6 Russia 140 $ 1.35 $ 0.95 6% 7 Malaysia 100 $ 1.55 $ 0.75 4% 8 China 110 $ 1.65 $ 0.85 5% 9 10 11 12 Assumptions 13 Tubes per Day 14 Selling Price 15 Average Inventory (%) 16 Carrying Cost (%) 17 Units per Year 18 19
Step by Step Solution
There are 3 Steps involved in it

Get step-by-step solutions from verified subject matter experts