

Question: Please help with my business analytics excel homework! Please answer all parts to this question. Thanks so much! QUESTION 25 points Save Answer You are
Please help with my business analytics excel homework!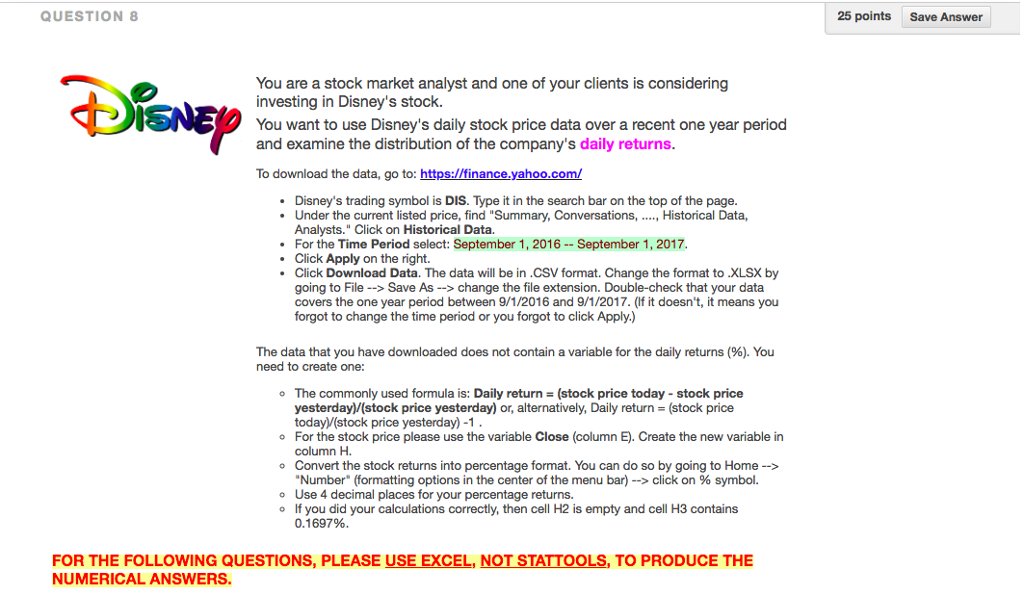
 Please answer all parts to this question. Thanks so much!
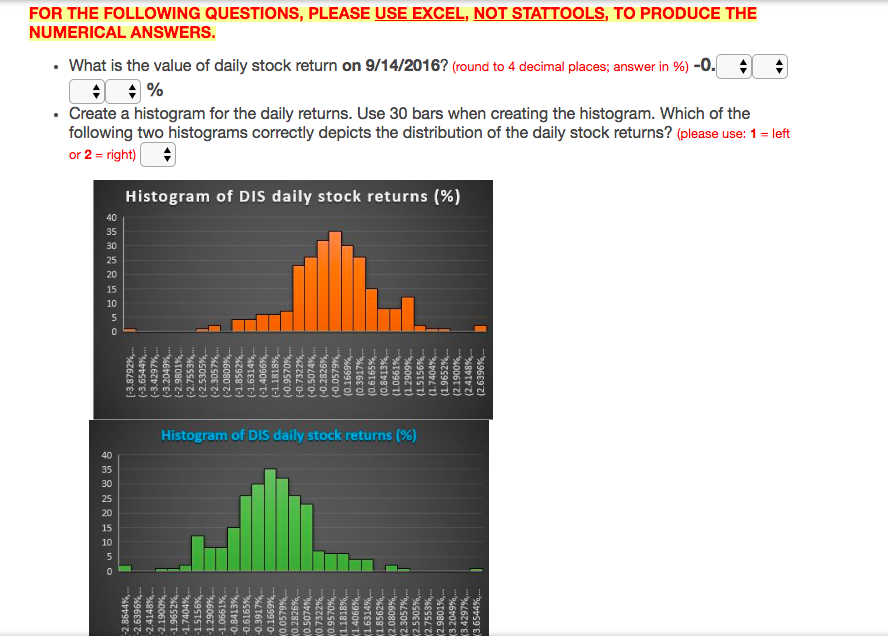
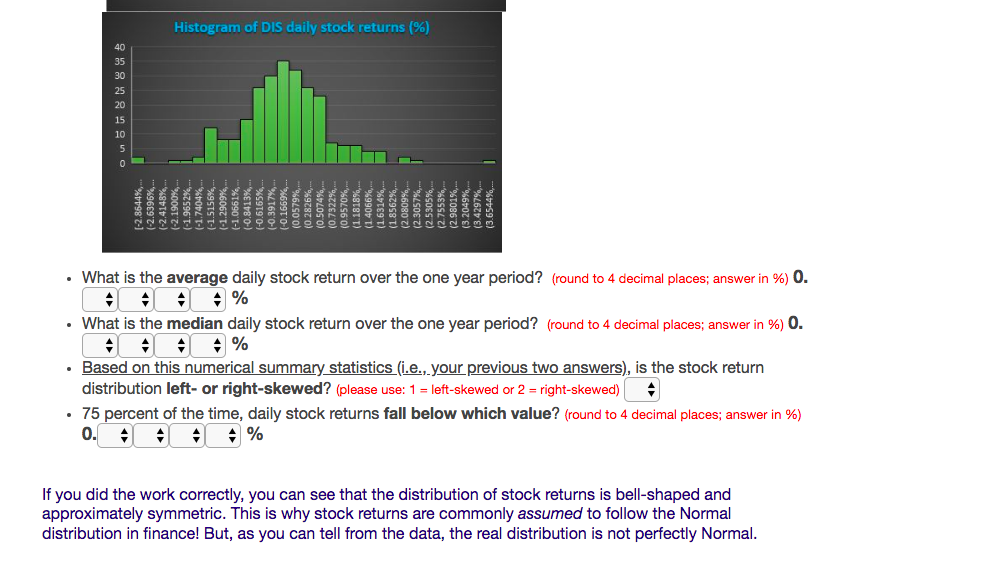
QUESTION 25 points Save Answer You are a stock market analyst and one of your clients is considering investing in Disney's stock. You want to use Disney's daily stock price data over a recent one year period and examine the distribution of the company's daily returns To download the data, go to: https://finance.yahoo.com/ Disney's trading symbol is DIS. Type it in the search bar on the top of the page Under the current listed price, find "Summary, Conversations,., Historical Data, Analysts." Click on Historical Data. For the Time Period select: September 1, 2016-- September 1, 2017 Click Apply on the right. Click Download Data. The data will be in .CSV format. Change the format to XLSX by going to File- Save As--change the file extension. Double-check that your data covers the one year period between 9/1/2016 and 9/1/2017. (If it doesn't, it means you forgot to change the time period or you forgot to click Apply) The data that you have downloaded does not contain a variable for the daily returns (%). You need to create one: o The commonly used formula is: Daily return (stock price today-stock price yesterday)/(stock price yesterday) or, alternatively, Daily return (stock price o For the stock price please use the variable Close (column E). Create the new variable in o Convert the stock returns into percentage format. You can do so by going to Home > o Use 4 decimal places for your percentage returns. today (stock price yesterday)-1 column H. "Number" (formatting options in the center of the menu bar)--> click on % symbol. If you did your calculations correctly, then cell H2 is empty and cell H3 contains o 0.1697% FOR THE FOLLOWING QUESTIONS, PLEASE USE EXCEL, NOT STATTOOLS, TO PRODUCE THE NUMERICAL ANSWERS FOR THE FOLLOWING QUESTIONS, PLEASE USE EXCEL, NOT STATTOOLS, TO PRODUCE THE NUMERICAL ANSWERS . what is the value of daily stock return on 9/14/2016? (round to 4 decimal places, answer in %)-0. Create a histogram for the daily returns. Use 30 bars when creating the histogram. Which of the following two histograms correctly depicts the distribution of the daily stock returns? (please use: 1-left or 2- right) Histogra m of DIS daily stock returns (%) 35 30 25 20 15 10 Histogram of DIS daily stock returns (%) 40 35 30 25 20 15 10 Histogram of DIS daily stock returns (%) 40 35 30 25 20 15 10 . What is the average daily stock return over the one year period? (round to 4 decimal places, answer in 96) 0. . What is the median daily stock return over the one year period? (round to 4 decimal places; answer in 96) . Based on this numerical summary statistics (i.e., your previous two answers), is the stock return distribution left-or right-skewed? (please use: 1 left-skewed or 2 - right-skewed) 75 percent of the time, daily stock returns fall below which value? (round to 4 decimal places; answer in %) If you did the work correctly, you can see that the distribution of stock returns is bell-shaped and approximately symmetric. This is why stock returns are commonly assumed to follow the Normal distribution in finance! But, as you can tell from the data, the real distribution is not perfectly Normal QUESTION 25 points Save Answer You are a stock market analyst and one of your clients is considering investing in Disney's stock. You want to use Disney's daily stock price data over a recent one year period and examine the distribution of the company's daily returns To download the data, go to: https://finance.yahoo.com/ Disney's trading symbol is DIS. Type it in the search bar on the top of the page Under the current listed price, find "Summary, Conversations,., Historical Data, Analysts." Click on Historical Data. For the Time Period select: September 1, 2016-- September 1, 2017 Click Apply on the right. Click Download Data. The data will be in .CSV format. Change the format to XLSX by going to File- Save As--change the file extension. Double-check that your data covers the one year period between 9/1/2016 and 9/1/2017. (If it doesn't, it means you forgot to change the time period or you forgot to click Apply) The data that you have downloaded does not contain a variable for the daily returns (%). You need to create one: o The commonly used formula is: Daily return (stock price today-stock price yesterday)/(stock price yesterday) or, alternatively, Daily return (stock price o For the stock price please use the variable Close (column E). Create the new variable in o Convert the stock returns into percentage format. You can do so by going to Home > o Use 4 decimal places for your percentage returns. today (stock price yesterday)-1 column H. "Number" (formatting options in the center of the menu bar)--> click on % symbol. If you did your calculations correctly, then cell H2 is empty and cell H3 contains o 0.1697% FOR THE FOLLOWING QUESTIONS, PLEASE USE EXCEL, NOT STATTOOLS, TO PRODUCE THE NUMERICAL ANSWERS FOR THE FOLLOWING QUESTIONS, PLEASE USE EXCEL, NOT STATTOOLS, TO PRODUCE THE NUMERICAL ANSWERS . what is the value of daily stock return on 9/14/2016? (round to 4 decimal places, answer in %)-0. Create a histogram for the daily returns. Use 30 bars when creating the histogram. Which of the following two histograms correctly depicts the distribution of the daily stock returns? (please use: 1-left or 2- right) Histogra m of DIS daily stock returns (%) 35 30 25 20 15 10 Histogram of DIS daily stock returns (%) 40 35 30 25 20 15 10 Histogram of DIS daily stock returns (%) 40 35 30 25 20 15 10 . What is the average daily stock return over the one year period? (round to 4 decimal places, answer in 96) 0. . What is the median daily stock return over the one year period? (round to 4 decimal places; answer in 96) . Based on this numerical summary statistics (i.e., your previous two answers), is the stock return distribution left-or right-skewed? (please use: 1 left-skewed or 2 - right-skewed) 75 percent of the time, daily stock returns fall below which value? (round to 4 decimal places; answer in %) If you did the work correctly, you can see that the distribution of stock returns is bell-shaped and approximately symmetric. This is why stock returns are commonly assumed to follow the Normal distribution in finance! But, as you can tell from the data, the real distribution is not perfectly Normal
Step by Step Solution
There are 3 Steps involved in it

Get step-by-step solutions from verified subject matter experts