

Question: Please help with problem 27.35(a,b,c) Please, show all work and calculations step by step 27.35 Rain for California? The changing climate will probably alter the
Please help with problem 27.35(a,b,c) Please, show all work and calculations step by step
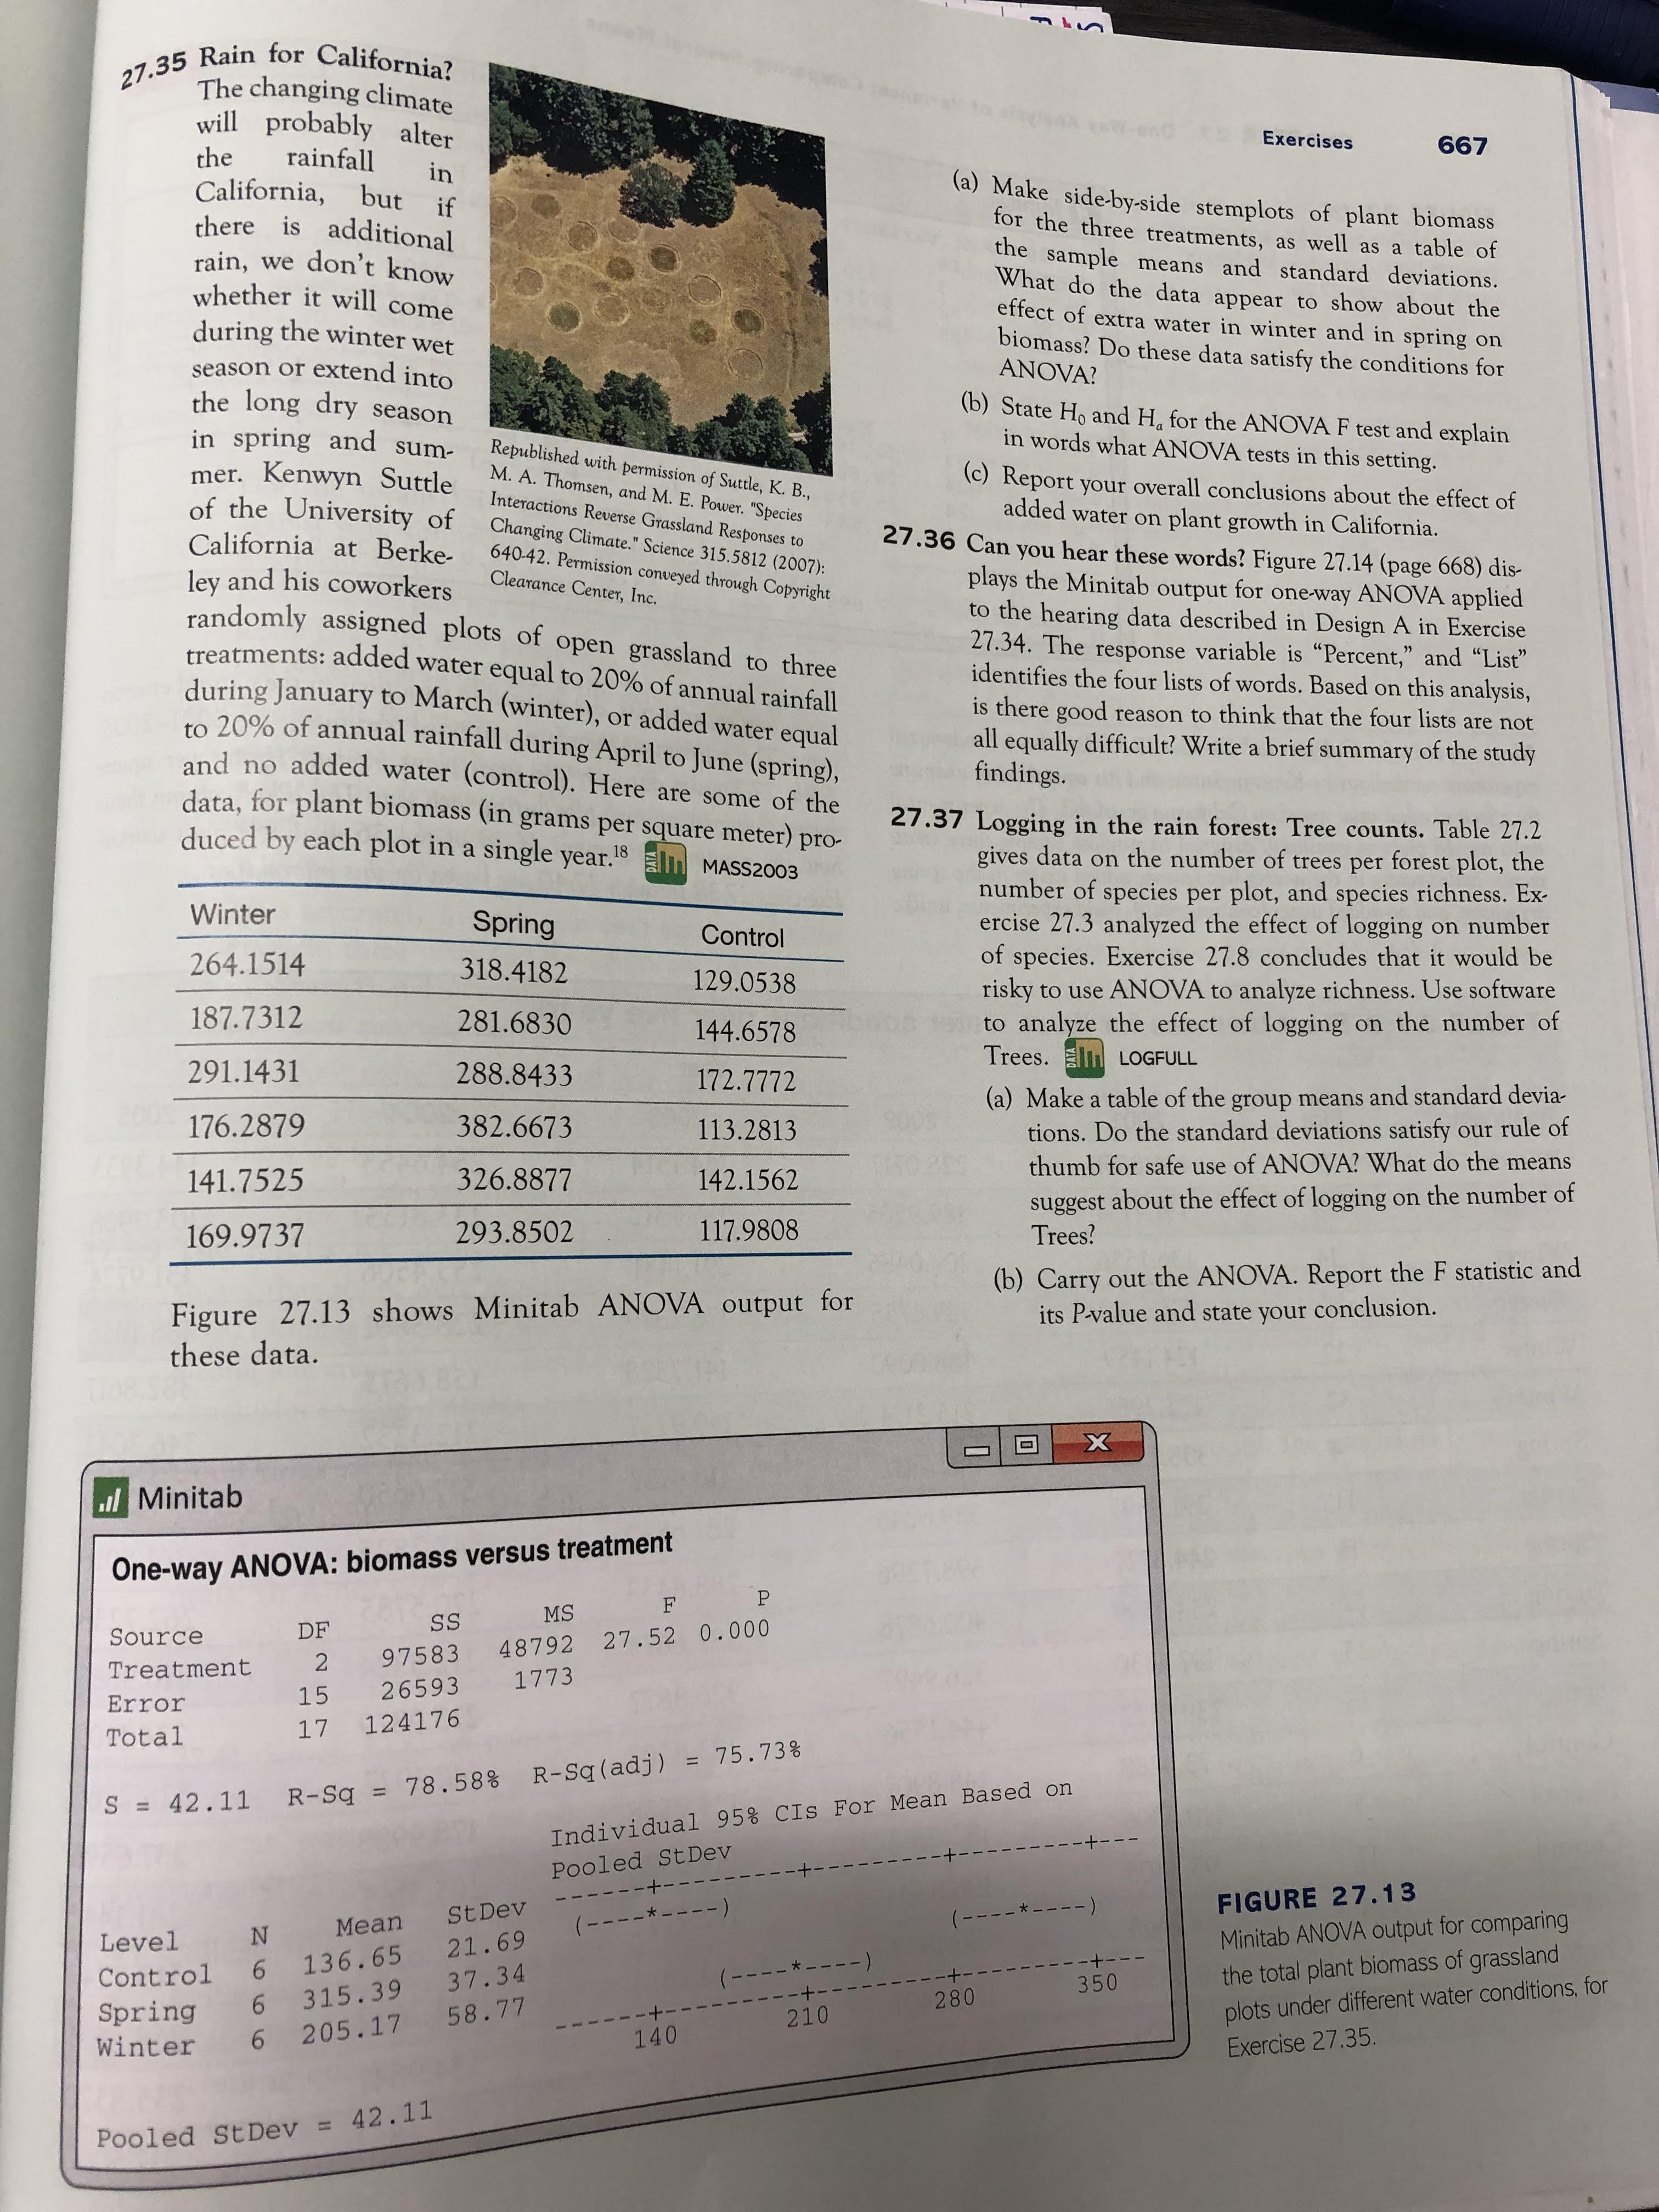
27.35 Rain for California? The changing climate will probably alter the rainfall Exercises 667 California, but if in there is additional (a) Make side-by-side stemplots of plant biomass for the three treatments, as well as a table of rain, we don't know the sample means and standard deviations. whether it will come What do the data appear to show about the during the winter wet effect of extra water in winter and in spring on season or extend into biomass? Do these data satisfy the conditions for ANOVA? the long dry season in spring and sum- b) State Ho and Ha for the ANOVA F test and explain mer. Kenwyn Suttle Republished with permission of Suttle, K. B., in words what ANOVA tests in this setting. of the University of M. A. Thomsen, and M. E. Power. "Species (c) Report your overall conclusions about the effect of California at Berke- Interactions Reverse Grassland Responses to added water on plant growth in California. Changing Climate." Science 315.5812 (2007): ley and his coworkers 640-42. Permission conveyed through Copyright 27.36 Can you hear these words? Figure 27.14 (page 668) dis- Clearance Center, Inc. plays the Minitab output for one-way ANOVA applied randomly assigned plots of open grassland to three to the hearing data described in Design A in Exercise treatments: added water equal to 20% of annual rainfall 27.34. The response variable is "Percent," and "List" during January to March (winter), or added water equal identifies the four lists of words. Based on this analysis, to 20% of annual rainfall during April to June (spring), is there good reason to think that the four lists are not all equally difficult? Write a brief summary of the study and no added water (control). Here are some of the findings. data, for plant biomass (in grams per square meter) pro- duced by each plot in a single year. 18 | MASS2003 27.37 Logging in the rain forest: Tree counts. Table 27.2 gives data on the number of trees per forest plot, the Winter number of species per plot, and species richness. Ex- Spring 264.1514 Control ercise 27.3 analyzed the effect of logging on number 318.4182 129.0538 of species. Exercise 27.8 concludes that it would be risky to use ANOVA to analyze richness. Use software 187.7312 281.6830 144.6578 to analyze the effect of logging on the number of 291.1431 288.8433 172.7772 Trees. I LOGFULL (a) Make a table of the group means and standard devia- 176.2879 382.6673 113.2813 tions. Do the standard deviations satisfy our rule of 141.7525 326.8877 142.1562 thumb for safe use of ANOVA? What do the means suggest about the effect of logging on the number of 169.9737 293.8502 117.9808 Trees ? (b) Carry out the ANOVA. Report the F statistic and Figure 27.13 shows Minitab ANOVA output for its P-value and state your conclusion. these data. - O X all Minitab One-way ANOVA: biomass versus treatment SS MS F Source DF 97583 27 . 52 0.000 Treatment 2 48792 Error 15 26593 1773 Total 17 124176 S = 42. 11 R-Sq = 78.58% R-Sq (adj) = 75. 73: Individual 95% CIs For Mean Based on Pooled StDev - + - - - --+ - StDev - - * -. ( - - - -* - - --) FIGURE 27.13 Level N Mean Minitab ANOVA output for comparing 6 136.65 21. 69 Control 37.34 -+- the total plant biomass of grassland Spring 6 315.39 58.77 280 350 6 210 plots under different water conditions, for Winter 205. 17 140 Exercise 27.35. Pooled StDev = 42. 11
Step by Step Solution
There are 3 Steps involved in it

Get step-by-step solutions from verified subject matter experts