

Question: Please help with question 2 A B and C please i am stuck.. data link- https://docs.google.com/spreadsheets/u/0/d/1fGDvs5wxBJ8VxHMeLRufP727jGkA6-NlUzKNRdV9WKA/htmlview '47 ..n a [:1- 1 Safari m increase their
Please help with question 2 A B and C please i am stuck..
data link- https://docs.google.com/spreadsheets/u/0/d/1fGDvs5wxBJ8VxHMeLRufP727jGkA6-NlUzKNRdV9WKA/htmlview
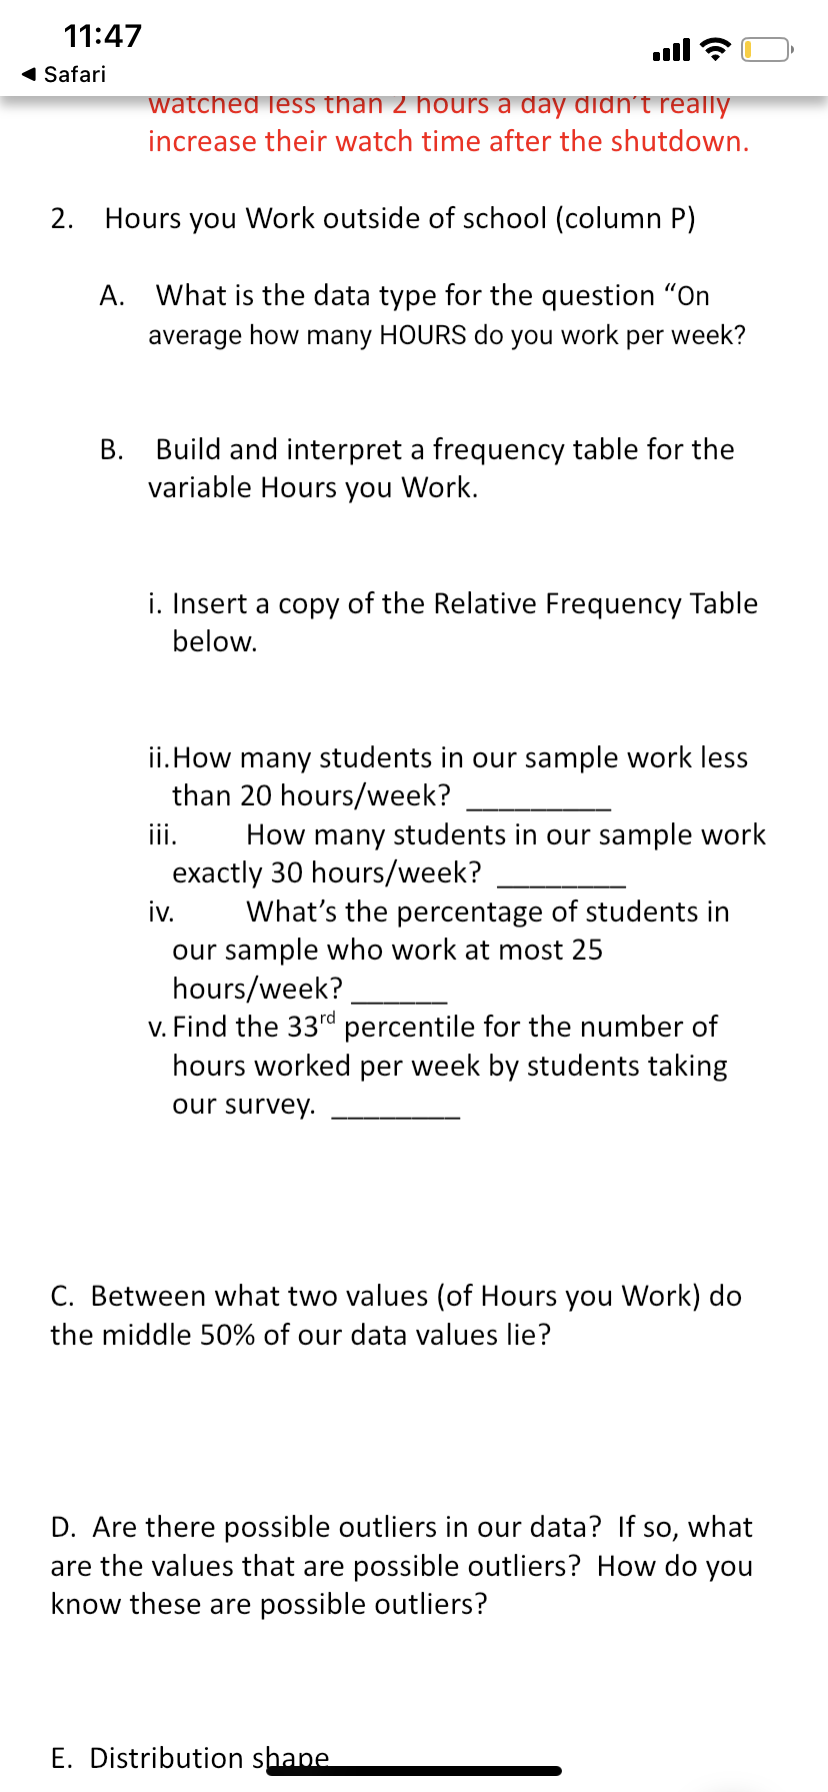
\"'47 ..n a [:1- 1 Safari m increase their watch time after the shutdown. 2. Hours you Work outside of school (column P) A. What is the data type for the question \"On average how many HOURS do you work per week? B. Build and interpret a frequency table for the variable Hours you Work. i. Insert a copy ofthe Relative Frequency Table below. ii.How many students in our sample work less than 20 hours/week? iii. How many students in our sample work exactly 30 hours/week? iv. What's the percentage of students in our sample who work at most 25 hours/week? v. Find the 33rd percentile for the number of hours worked per week by students taking our survey. C. Between what two values (of Hours you Work) do the middle 50% of our data values lie? D. Are there possible outliers in our data? If so, what are the values that are possible outliers? How do you know these are possible outliers? E. Distribution 5%
Step by Step Solution
There are 3 Steps involved in it

Get step-by-step solutions from verified subject matter experts