

Question: please help with question 2.1- 2.4 and show workings , thank you Question Two [20 Marles) The table below shows the demand for a new
please help with question 2.1- 2.4 and show workings , thank you
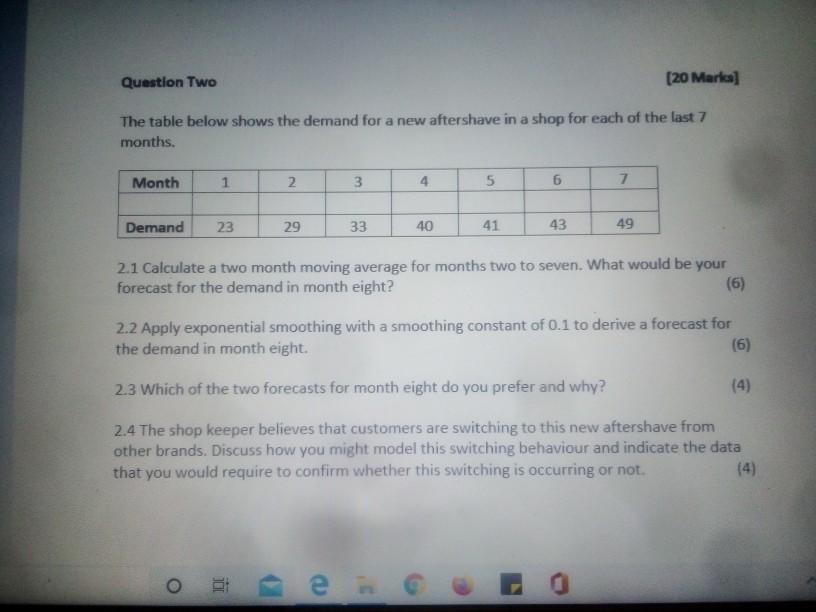
Question Two [20 Marles) The table below shows the demand for a new aftershave in a shop for each of the last 7 months. Month 1 2. 3 4 5 6 7 Demand 23 29 33 40 41 43 49 2.1 Calculate a two month moving average for months two to seven. What would be your forecast for the demand in month eight? (6) 2.2 Apply exponential smoothing with a smoothing constant of 0.1 to derive a forecast for the demand in month eight. (6) 23 Which of the two forecasts for month eight do you prefer and why? (4) 2.4 The shop keeper believes that customers are switching to this new aftershave from other brands. Discuss how you might model this switching behaviour and indicate the data that you would require to confirm whether this switching is occurring or not. OStep by Step Solution
There are 3 Steps involved in it
1 Expert Approved Answer
Step: 1 Unlock

Question Has Been Solved by an Expert!
Get step-by-step solutions from verified subject matter experts
Step: 2 Unlock
Step: 3 Unlock