

Question: Please help with question #2,Thanks. The histogram below represents scores achieved by 250 job applicants on a personality profile. Relative frequency 0.20 0.20 0.20 0.20
Please help with question #2,Thanks.
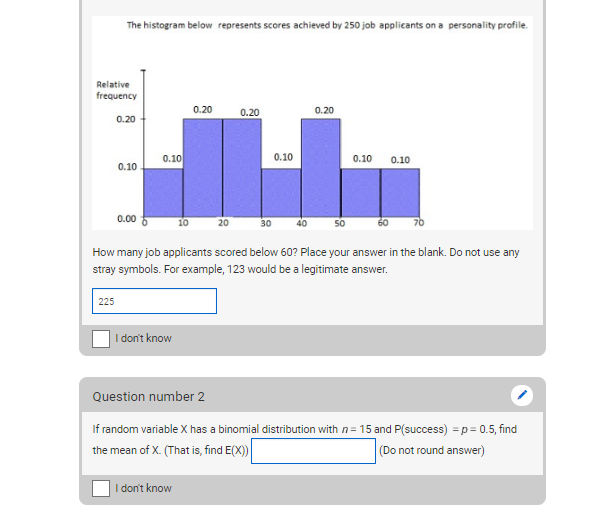 The histogram below represents scores achieved by 250 job applicants on a personality profile. Relative frequency 0.20 0.20 0.20 0.20 0.10 0.10 0.10 0.10 0.10 0.00 6 10 20 40 SO 60 70 How many job applicants scored below 60? Place your answer in the blank. Do not use any stray symbols. For example, 123 would be a legitimate answer. 225 I don't know Question number 2 If random variable X has a binomial distribution with n = 15 and P(success) = p = 0.5, find the mean of X. (That is, find E(X()) Do not round answer) I don't know
Step by Step Solution
There are 3 Steps involved in it
1 Expert Approved Answer
Step: 1 Unlock

Question Has Been Solved by an Expert!
Get step-by-step solutions from verified subject matter experts
Step: 2 Unlock
Step: 3 Unlock