

Question: Please help with Question #3 PROBLEMS Note: Student solutions for problems whose numbers appear within a color box are available for purchase at www.cengagebrain.com. Level
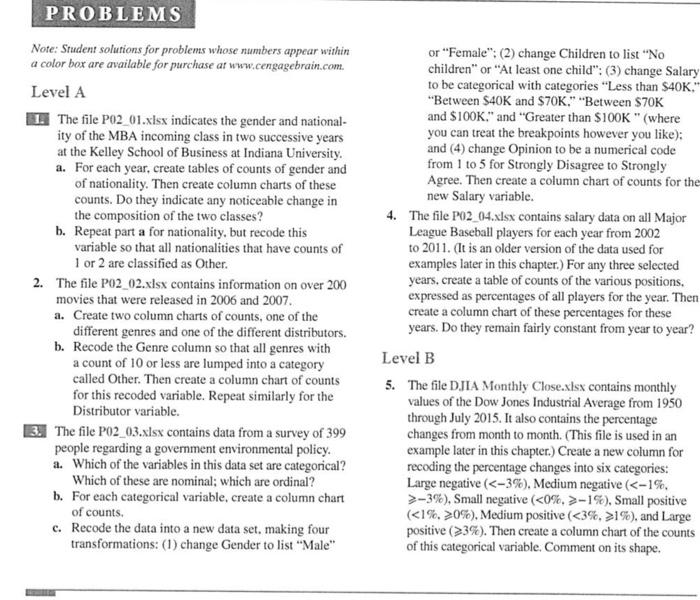
PROBLEMS Note: Student solutions for problems whose numbers appear within a color box are available for purchase at www.cengagebrain.com. Level A 1. The file P02 201.xisx indicates the gender and nationality of the MBA incoming class in two successive years at the Kelley School of Business at Indiana University. a. For each year, create tables of counts of gender and of nationality. Then create column charts of these counts. Do they indicate any noticeable change in the composition of the two classes? b. Repeat part a for nationality, but recode this variable so that all nationalities that have counts of 1 or 2 are classified as Other. 2. The file P02_02.xIsx contains information on over 200 movies that were released in 2006 and 2007. a. Create two column charts of counts, one of the different genres and one of the different distributors. b. Recode the Genre column so that all genres with a count of 10 or less are lumped into a category called Other. Then create a column chart of counts for this recoded variable. Repeat similarly for the Distributor variable. 3.. The file P02_03.xIsx contains data from a survey of 399 people regarding a govemment environmental policy. a. Which of the variables in this data set are categorical? Which of these are nominal; which are ordinal? b. For each categorical variable, create a column chart of counts. c. Recode the data into a new data set. making four transformations: (1) change Gender to list "Male" or "Female"; (2) change Children to list "No children" or "At least one child": (3) change Salary to be categorical with categories "Less than $40K," "Between $40K and $70K," "Between $70K and $100K," and "Greater than $100K " (where you can treat the breakpoints however you like); and (4) change Opinion to be a numerical code from 1 to 5 for Strongly Disagree to Strongly Agree. Then create a column chart of counts for the new Salary variable. 4. The file P02_04.xisx contains salary data on all Major League Baseball players for each year from 2002 to 2011. (It is an older version of the data used for examples later in this chapter.) For any three selected years, create a table of counts of the various positions, expressed as percentages of all players for the year. Then create a column chart of these percentages for these years. Do they remain fairly constant from year to year? Level B 5. The file DJIA Monthly Close.xisx contains monthly values of the Dow Jones Industrial Average from 1950 through July 2015. It also contains the percentage changes from month to month. (This file is used in an example later in this chapter.) Create a new column for recoding the percentage changes into six categories: Large negative (
Step by Step Solution
There are 3 Steps involved in it

Get step-by-step solutions from verified subject matter experts