

Question: Please help with questions 5-6 for the three soundings using the attached data sets. Thank you :) to the formation of mesocyclones in thunderstorms? 5.
Please help with questions 5-6 for the three soundings using the attached data sets. Thank you :) 
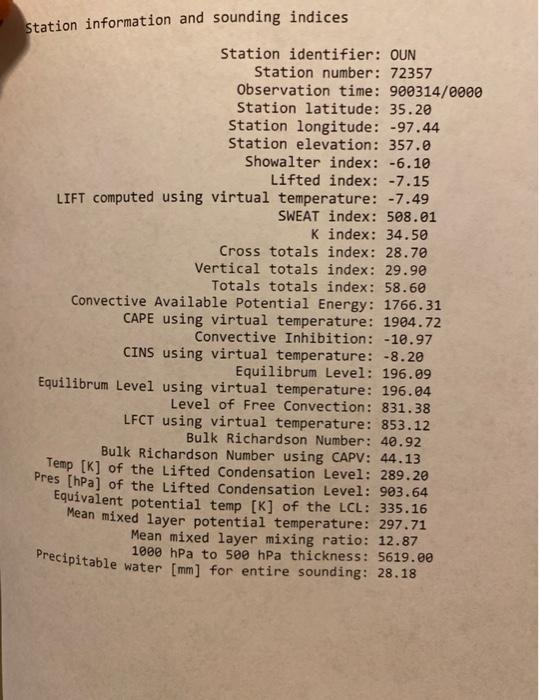
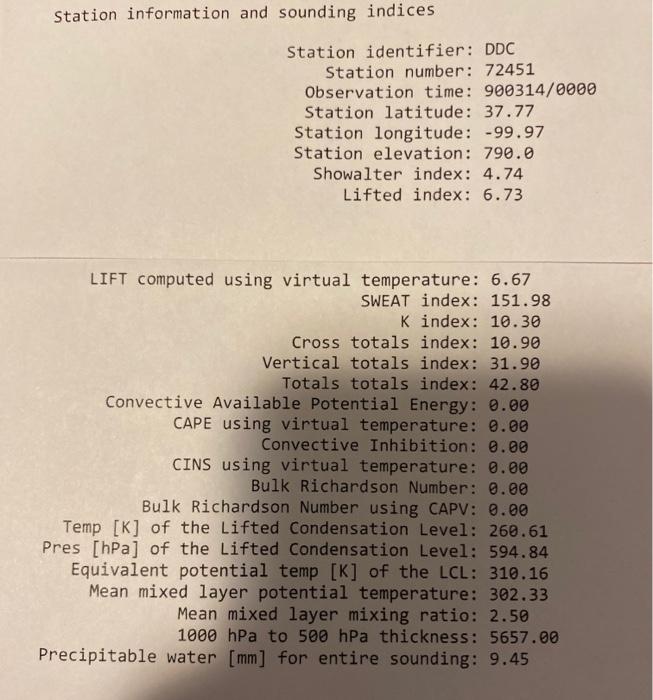
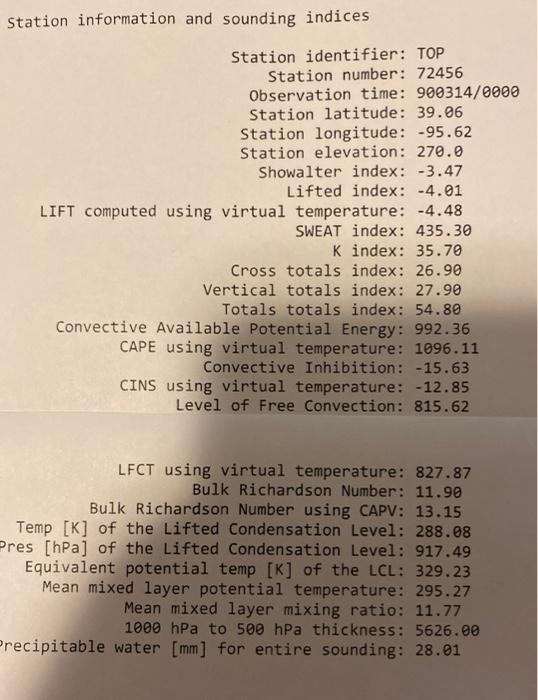
to the formation of mesocyclones in thunderstorms? 5. Give me the CAPE for these stations. For which is the CAPE larger than 500? (CAPE, or Convective Available Potential Energy, is listed near the bottom of each of the full text soundings. These three files have the station as their name are are of file extension .TXT.) 6. (Extra Credit): At which station is the Lifted Condensation Level (LCL) closest to the surface? Hint: "Closest" can mean "The difference between LCL and surface pressure is least." You can find the pressure of each Lifted Condensation Level in the information at the bottom of the sounding listing. station information and sounding indices Station identifier: OUN Station number: 72357 Observation time: 900314/0000 Station latitude: 35.20 Station longitude: -97.44 Station elevation: 357.0 Showalter index: -6.10 Lifted index: -7.15 LIFT computed using virtual temperature: -7.49 SWEAT index: 508.01 Kindex: 34.50 Cross totals index: 28.70 Vertical totals index: 29.90 Totals totals index: 58.60 Convective Available Potential Energy: 1766.31 CAPE using virtual temperature: 1994.72 Convective Inhibition: -10.97 CINS using virtual temperature: -8.20 Equilibrum Level: 196.09 Equilibrum Level using virtual temperature: 196.04 Level of Free Convection: 831.38 LFCT using virtual temperature: 853.12 Bulk Richardson Number: 40.92 Bulk Richardson Number using CAPV: 44.13 Temp [K] of the Lifted Condensation Level: 289.20 Pres [hPa] of the Lifted Condensation Level: 903.64 Equivalent potential temp [K] of the LCL: 335.16 Mean mixed layer potential temperature: 297.71 Mean mixed layer mixing ratio: 12.87 Precipitable water [mm] for entire sounding: 28.18 1000 hPa to 500 hPa thickness: 5619.00 Station information and sounding indices Station identifier: DDC Station number: 72451 Observation time: 900314/2009 Station latitude: 37.77 Station longitude: -99.97 Station elevation: 790.0 Showalter index: 4.74 Lifted index: 6.73 LIFT computed using virtual temperature: 6.67 SWEAT index: 151.98 K index: 10.30 Cross totals index: 10.90 Vertical totals index: 31.90 Totals totals index: 42.80 Convective Available Potential Energy: 0.00 CAPE using virtual temperature: 0.00 Convective Inhibition: 0.00 CINS using virtual temperature: 0.00 Bulk Richardson Number: 0.00 Bulk Richardson Number using CAPV: 0.00 Temp [K] of the Lifted Condensation Level: 260.61 Pres [hPa] of the Lifted Condensation Level: 594.84 Equivalent potential temp [K] of the LCL: 310.16 Mean mixed layer potential temperature: 302.33 Mean mixed layer mixing ratio: 2.50 1000 hPa to 500 hPa thickness: 5657.00 Precipitable water [mm] for entire sounding: 9.45 Station information and sounding indices Station identifier: TOP Station number: 72456 Observation time: 900314/0900 Station latitude: 39.06 Station longitude: -95.62 Station elevation: 270.0 Showalter index: -3.47 Lifted index: -4.01 LIFT computed using virtual temperature: -4.48 SWEAT index: 435.30 Kindex: 35.70 Cross totals index: 26.90 Vertical totals index: 27.90 Totals totals index: 54.80 Convective Available Potential Energy: 992.36 CAPE using virtual temperature: 1096.11 Convective Inhibition: -15.63 CINS using virtual temperature: -12.85 Level of Free Convection: 815.62 LFCT using virtual temperature: 827.87 Bulk Richardson Number: 11.90 Bulk Richardson Number using CAPV: 13.15 Temp [K] of the Lifted Condensation Level: 288.08 Pres [hPa] of the Lifted Condensation Level: 917.49 Equivalent potential temp [K] of the LCL: 329.23 Mean mixed layer potential temperature: 295.27 Mean mixed layer mixing ratio: 11.77 1000 hPa to 500 hPa thickness: 5626.00 Precipitable water [mm] for entire sounding: 28.01 to the formation of mesocyclones in thunderstorms? 5. Give me the CAPE for these stations. For which is the CAPE larger than 500? (CAPE, or Convective Available Potential Energy, is listed near the bottom of each of the full text soundings. These three files have the station as their name are are of file extension .TXT.) 6. (Extra Credit): At which station is the Lifted Condensation Level (LCL) closest to the surface? Hint: "Closest" can mean "The difference between LCL and surface pressure is least." You can find the pressure of each Lifted Condensation Level in the information at the bottom of the sounding listing. station information and sounding indices Station identifier: OUN Station number: 72357 Observation time: 900314/0000 Station latitude: 35.20 Station longitude: -97.44 Station elevation: 357.0 Showalter index: -6.10 Lifted index: -7.15 LIFT computed using virtual temperature: -7.49 SWEAT index: 508.01 Kindex: 34.50 Cross totals index: 28.70 Vertical totals index: 29.90 Totals totals index: 58.60 Convective Available Potential Energy: 1766.31 CAPE using virtual temperature: 1994.72 Convective Inhibition: -10.97 CINS using virtual temperature: -8.20 Equilibrum Level: 196.09 Equilibrum Level using virtual temperature: 196.04 Level of Free Convection: 831.38 LFCT using virtual temperature: 853.12 Bulk Richardson Number: 40.92 Bulk Richardson Number using CAPV: 44.13 Temp [K] of the Lifted Condensation Level: 289.20 Pres [hPa] of the Lifted Condensation Level: 903.64 Equivalent potential temp [K] of the LCL: 335.16 Mean mixed layer potential temperature: 297.71 Mean mixed layer mixing ratio: 12.87 Precipitable water [mm] for entire sounding: 28.18 1000 hPa to 500 hPa thickness: 5619.00 Station information and sounding indices Station identifier: DDC Station number: 72451 Observation time: 900314/2009 Station latitude: 37.77 Station longitude: -99.97 Station elevation: 790.0 Showalter index: 4.74 Lifted index: 6.73 LIFT computed using virtual temperature: 6.67 SWEAT index: 151.98 K index: 10.30 Cross totals index: 10.90 Vertical totals index: 31.90 Totals totals index: 42.80 Convective Available Potential Energy: 0.00 CAPE using virtual temperature: 0.00 Convective Inhibition: 0.00 CINS using virtual temperature: 0.00 Bulk Richardson Number: 0.00 Bulk Richardson Number using CAPV: 0.00 Temp [K] of the Lifted Condensation Level: 260.61 Pres [hPa] of the Lifted Condensation Level: 594.84 Equivalent potential temp [K] of the LCL: 310.16 Mean mixed layer potential temperature: 302.33 Mean mixed layer mixing ratio: 2.50 1000 hPa to 500 hPa thickness: 5657.00 Precipitable water [mm] for entire sounding: 9.45 Station information and sounding indices Station identifier: TOP Station number: 72456 Observation time: 900314/0900 Station latitude: 39.06 Station longitude: -95.62 Station elevation: 270.0 Showalter index: -3.47 Lifted index: -4.01 LIFT computed using virtual temperature: -4.48 SWEAT index: 435.30 Kindex: 35.70 Cross totals index: 26.90 Vertical totals index: 27.90 Totals totals index: 54.80 Convective Available Potential Energy: 992.36 CAPE using virtual temperature: 1096.11 Convective Inhibition: -15.63 CINS using virtual temperature: -12.85 Level of Free Convection: 815.62 LFCT using virtual temperature: 827.87 Bulk Richardson Number: 11.90 Bulk Richardson Number using CAPV: 13.15 Temp [K] of the Lifted Condensation Level: 288.08 Pres [hPa] of the Lifted Condensation Level: 917.49 Equivalent potential temp [K] of the LCL: 329.23 Mean mixed layer potential temperature: 295.27 Mean mixed layer mixing ratio: 11.77 1000 hPa to 500 hPa thickness: 5626.00 Precipitable water [mm] for entire sounding: 28.01
Step by Step Solution
There are 3 Steps involved in it
1 Expert Approved Answer
Step: 1 Unlock

Question Has Been Solved by an Expert!
Get step-by-step solutions from verified subject matter experts
Step: 2 Unlock
Step: 3 Unlock