

Question: please help with questions and if corrections are needed Desmos Scientific Calculator Researchers asked a sample of people, How many years have you lived in
please help with questions and if corrections are needed
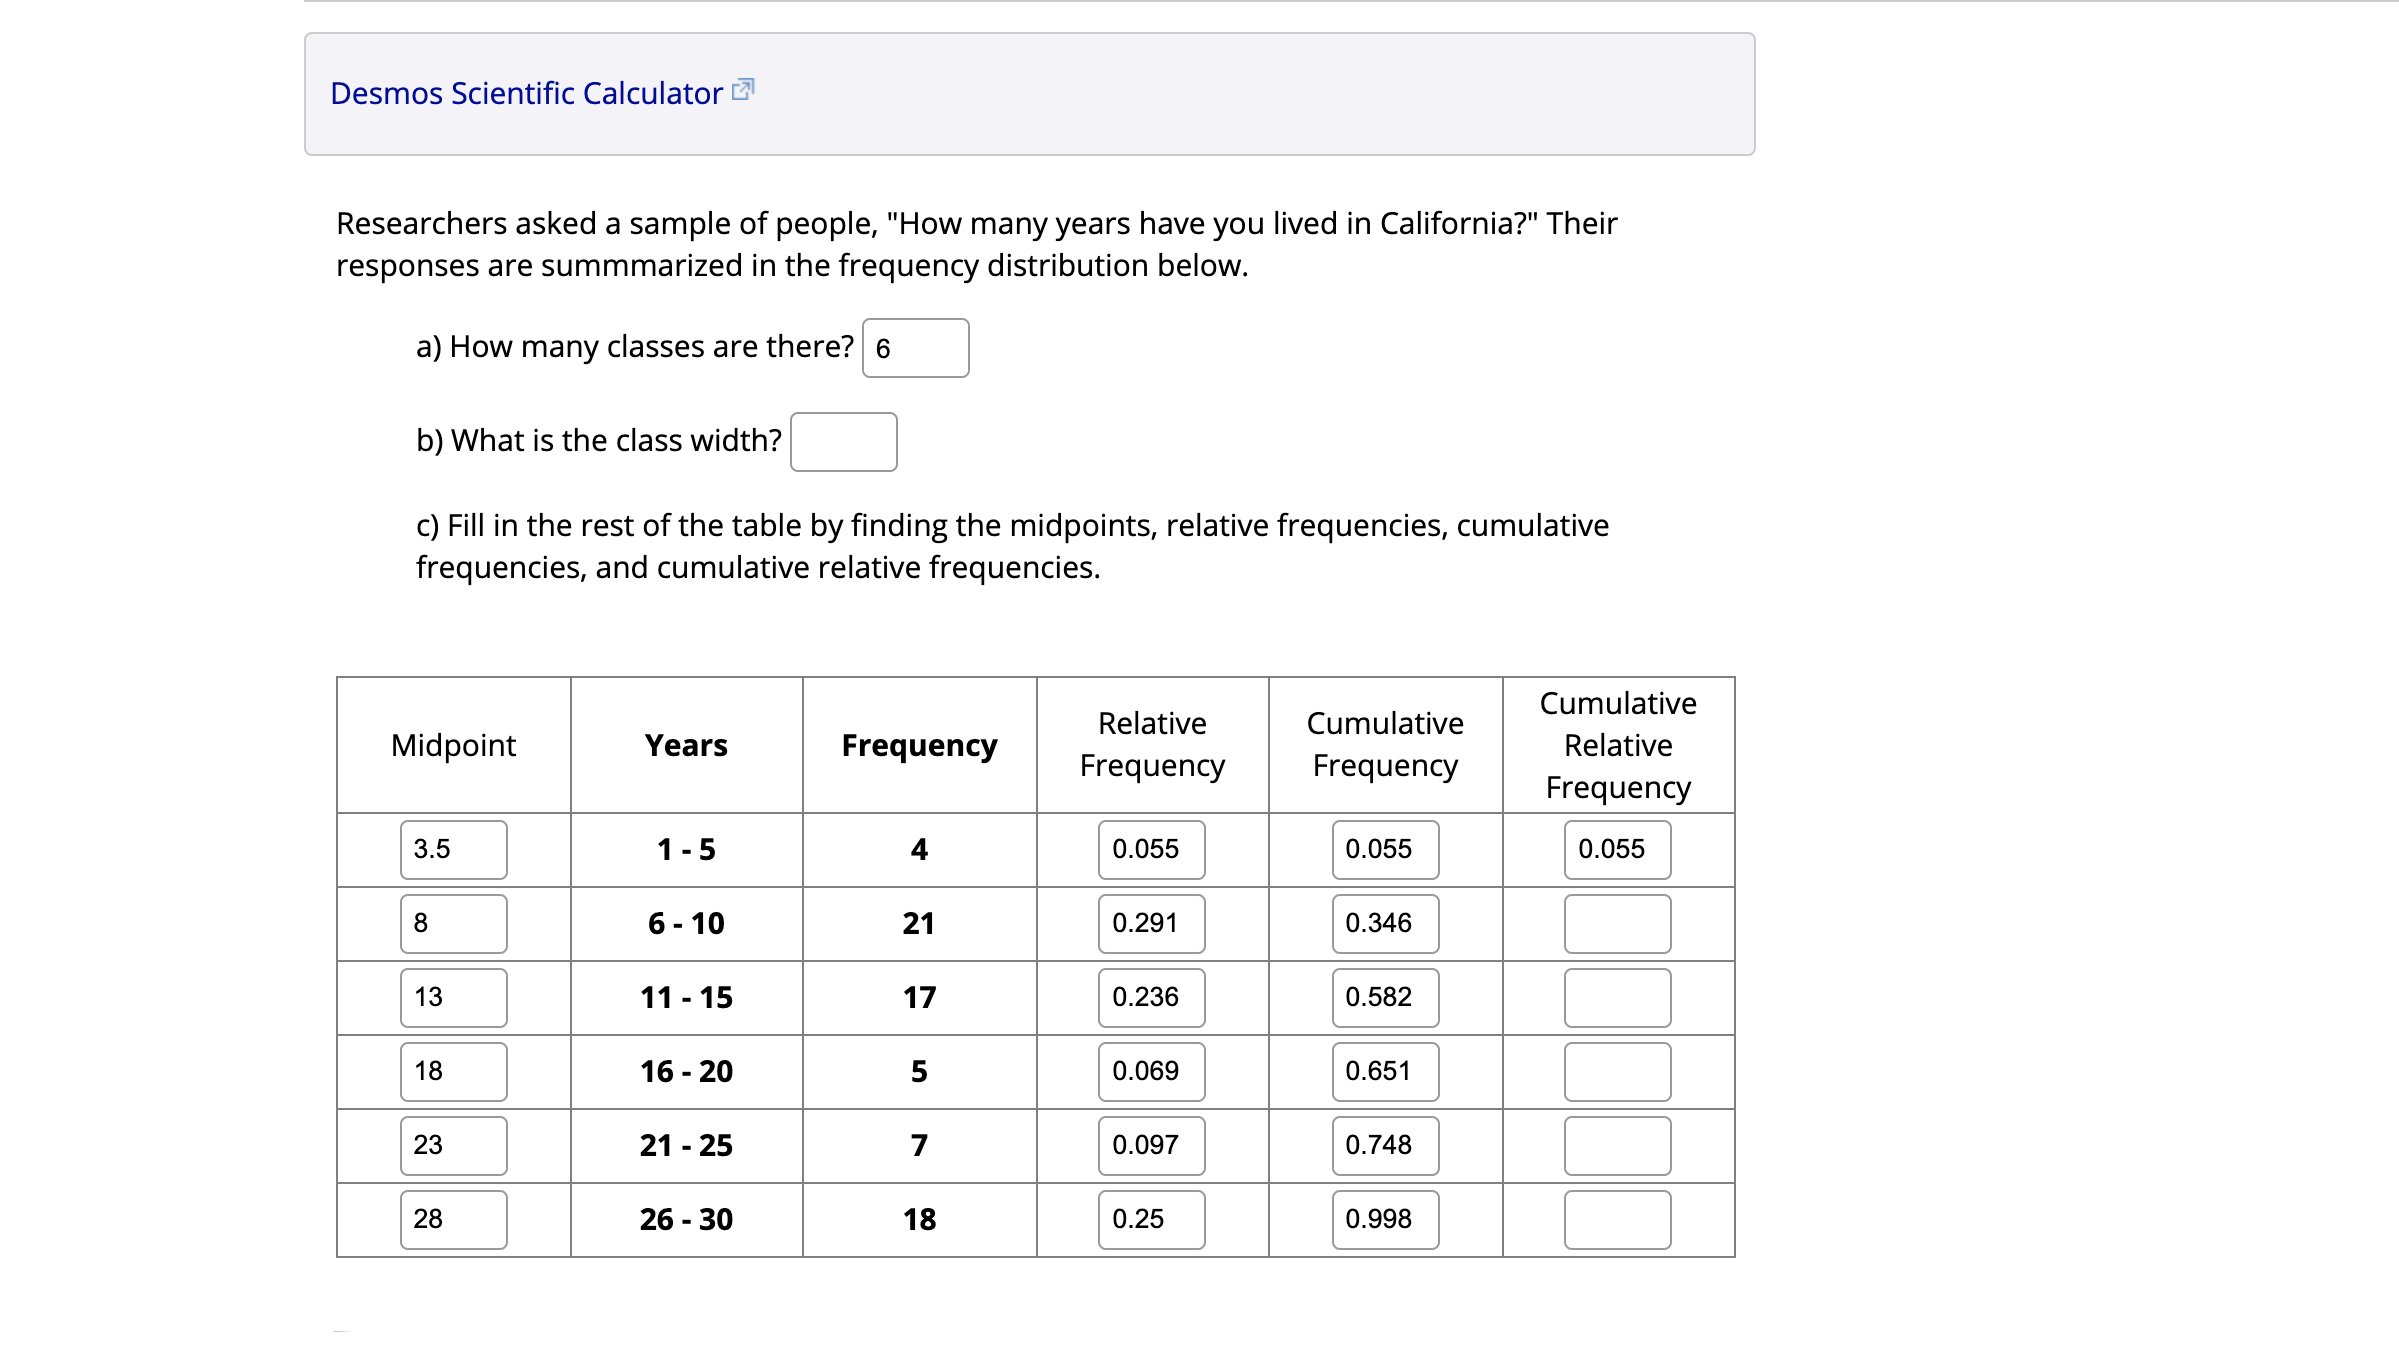
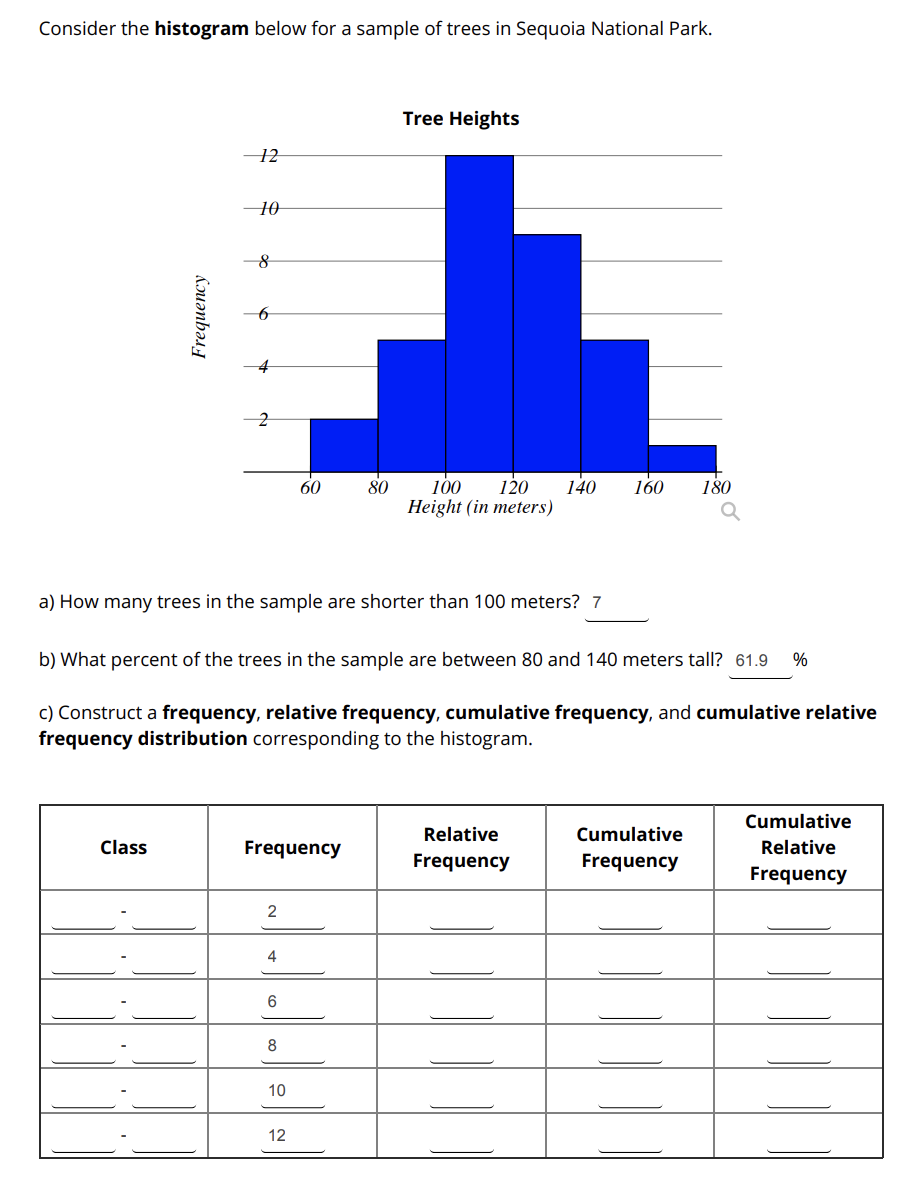
Desmos Scientific Calculator Researchers asked a sample of people, "How many years have you lived in California?" Their responses are summmarized in the frequency distribution below. a) How many classes are there? | 6 b) What is the class width? c) Fill in the rest of the table by finding the midpoints, relative frequencies, cumulative frequencies, and cumulative relative frequencies. Cumulative Midpoint Years Relative Frequency Cumulative Frequency Frequency Relative Frequency 3.5 1-5 4 0.055 0.055 0.055 8 6 - 10 21 0.291 0.346 13 11 - 15 17 0.236 0.582 18 16 - 20 5 0.069 0.651 23 21 - 25 7 0.097 0.748 28 26 - 30 18 0.25 0.998Consider the histogram below for a sample of trees in Sequoia National Park. Tree Heights Frequency 60 80 I 00 120 I 40 160 I 80 Height ( in meters) Q a) How many trees in the sample are shorter than 100 mete rs? 7 b) What percent of the trees in the sample are between 80 and 140 meters tall? 61.9 % c} Construct a frequency, relative frequency, cumulative frequency, and cumulative relative frequency distribution corresponding to the histogram. . . Cumulative Relative Cu mulatlve . Frequency Relative Frequency Frequency Frequency _____ _____ .. 5, Hr \\i .. \ ~ ~a \ '1 \\ u c, u_-' u, u, J . ir
Step by Step Solution
There are 3 Steps involved in it

Get step-by-step solutions from verified subject matter experts