

Question: Please help with Step by step instructions on how to move through each step in excel starting with #8 Exces Project EX16 XL_CH06_GRADER_CAP_HW - Delta
 Please help with Step by step instructions on how to move through each step in excel starting with #8
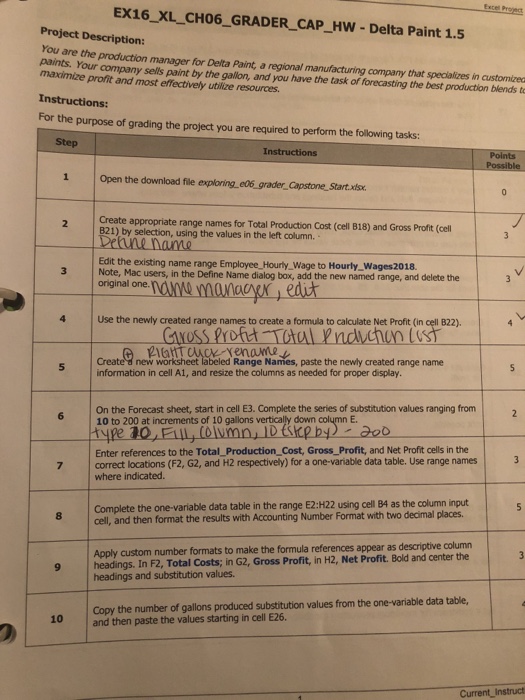
 Exces Project EX16 XL_CH06_GRADER_CAP_HW - Delta Paint 1.5 Project Description: You are the production manager for Delta Paint, a regional manufacturing company that specializes in customized paints. Your company sells paint by the gallon, and you have the task of forecasting the best production blends to maximize profit and most effectively utilize resources. Instructions: For the purpose of grading the project you are required to perform the following tasks: Step Instructions Points 1 Open the download file exploring e06 grader Capstone Start.xisx. Create appropriate range names for Total Production Cost (cell B18) and Gross Profit (cell B21) by selection, using the values in the left column. Edit the existing name range Employee Hourly_Wage to Hourly_Wages2018 Note, Mac users, in the Define Name dialog box, add the new named range, and delete the original one. Use the newly created range names to create a formula to calculate Net Profit (in cell B22) Create d new eet labeled Range Names, paste the newly created range name information in cell A1, and resize the columns as needed for proper display. On the Forecast sheet, start in cell E3. Complete the series of substitution values ranging from 6 10 to 200 at increments of 10 gallons vertically down column E. Enter references to the Total_Production_ Cost, Gross Profit, and Net Profit cells in the where indicated 7 correct locations (F2, G2, and H2 respectively) for a one-variable data table. Use range names 3 Complete the one-variable data table in the range E2:H22 using cell B4 as the column input 8cell, and then format the results with Accounting Number Format with two decimal places Apply custom number formats to make the formula references appear as descriptive column headings. In F2, Total Costs; in G2, Gross Profit, in H2, Net Profit. Bold and center the headings and substitution values. 9 Copy the number of gallons produced substitution values from the one-variable data table, and then paste the values starting in cell E26. 10 Current_Instruct Exces Project EX16 XL_CH06_GRADER_CAP_HW - Delta Paint 1.5 Project Description: You are the production manager for Delta Paint, a regional manufacturing company that specializes in customized paints. Your company sells paint by the gallon, and you have the task of forecasting the best production blends to maximize profit and most effectively utilize resources. Instructions: For the purpose of grading the project you are required to perform the following tasks: Step Instructions Points 1 Open the download file exploring e06 grader Capstone Start.xisx. Create appropriate range names for Total Production Cost (cell B18) and Gross Profit (cell B21) by selection, using the values in the left column. Edit the existing name range Employee Hourly_Wage to Hourly_Wages2018 Note, Mac users, in the Define Name dialog box, add the new named range, and delete the original one. Use the newly created range names to create a formula to calculate Net Profit (in cell B22) Create d new eet labeled Range Names, paste the newly created range name information in cell A1, and resize the columns as needed for proper display. On the Forecast sheet, start in cell E3. Complete the series of substitution values ranging from 6 10 to 200 at increments of 10 gallons vertically down column E. Enter references to the Total_Production_ Cost, Gross Profit, and Net Profit cells in the where indicated 7 correct locations (F2, G2, and H2 respectively) for a one-variable data table. Use range names 3 Complete the one-variable data table in the range E2:H22 using cell B4 as the column input 8cell, and then format the results with Accounting Number Format with two decimal places Apply custom number formats to make the formula references appear as descriptive column headings. In F2, Total Costs; in G2, Gross Profit, in H2, Net Profit. Bold and center the headings and substitution values. 9 Copy the number of gallons produced substitution values from the one-variable data table, and then paste the values starting in cell E26. 10 Current_Instruct
Step by Step Solution
There are 3 Steps involved in it

Get step-by-step solutions from verified subject matter experts