

Question: PLEASE HELP WITH TAB 1 . please give me step by step instructions on excel and add notes as indicated on bottom Tab 1 -
PLEASE HELP WITH TAB please give me step by step instructions on excel and add notes as indicated on bottom
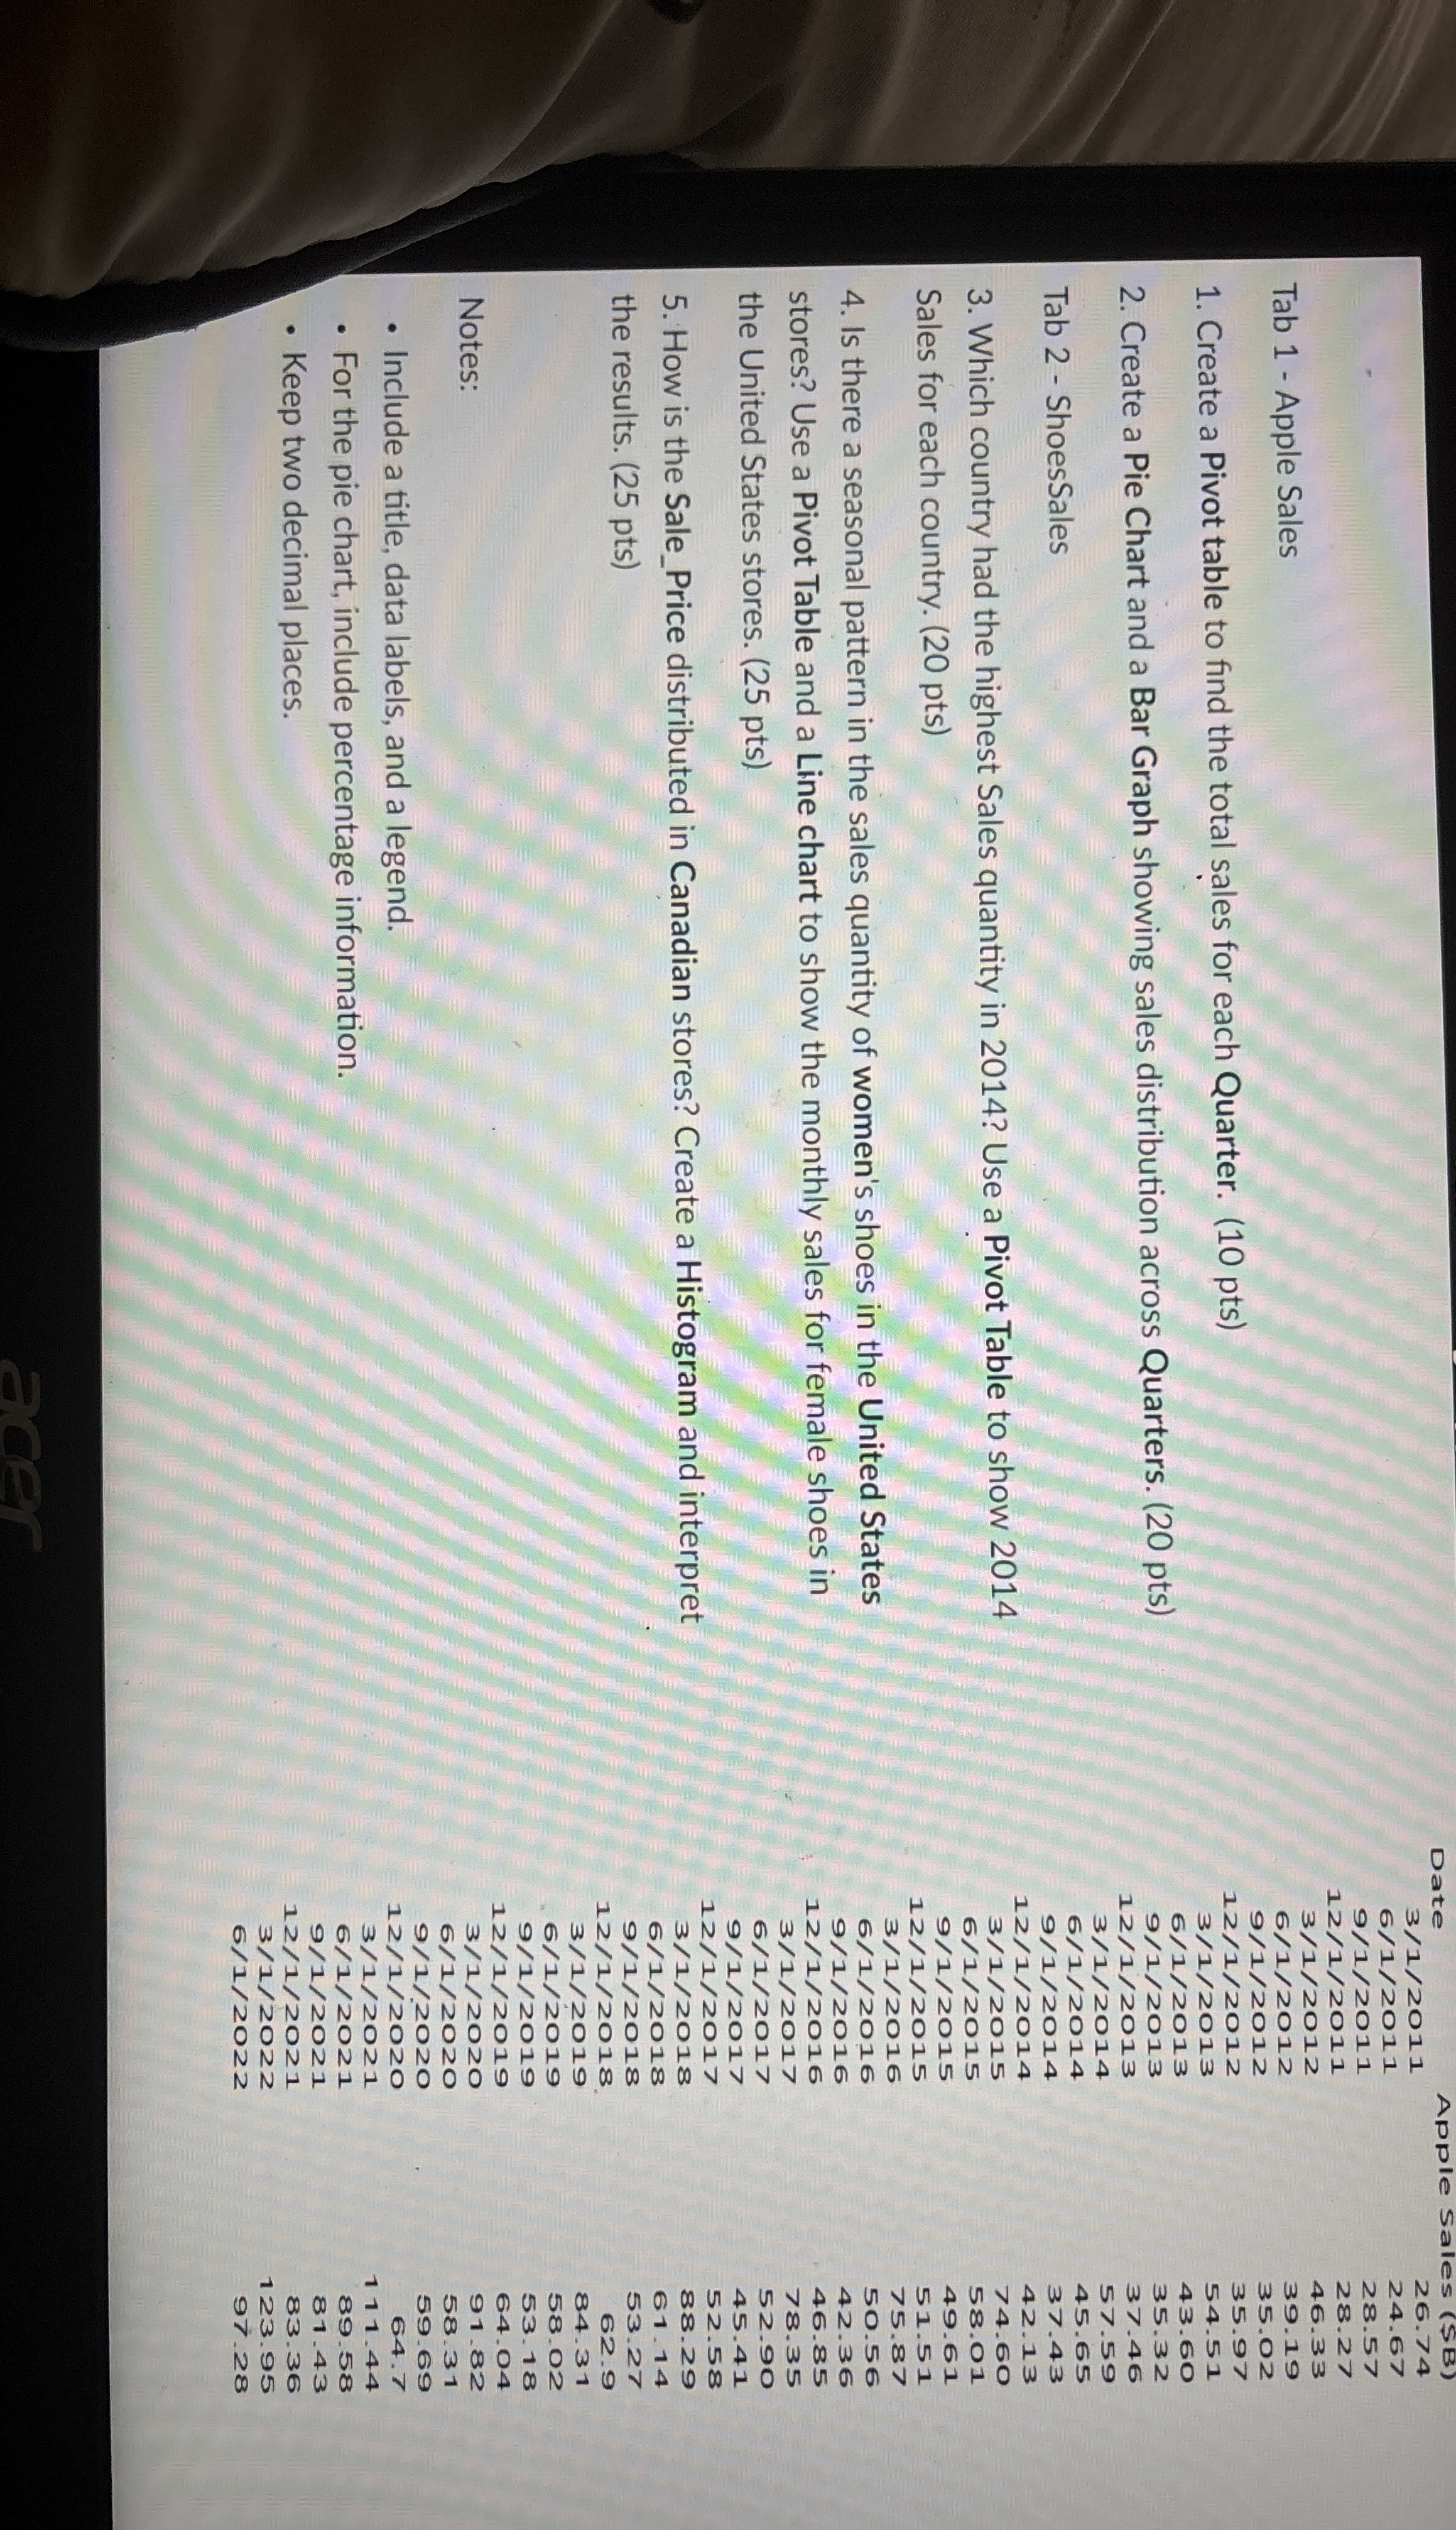
Tab Apple Sales
Create a Pivot table to find the total sales for each Quarter. pts
Create a Pie Chart and a Bar Graph showing sales distribution across Quarters. pts
Tab ShoesSales
Which country had the highest Sales quantity in Use a Pivot Table to show
Sales for each country. pts
Is there a seasonal pattern in the sales quantity of women's shoes in the United States
stores? Use a Pivot Table and a Line chart to show the monthly sales for female shoes in
the United States stores. pts
How is the SalePrice distributed in Canadian stores? Create a Histogram and interpret
the results. pts
Notes:
Include a title, data labels, and a legend.
For the pie chart, include percentage information.
Keep two decimal places.
Step by Step Solution
There are 3 Steps involved in it
1 Expert Approved Answer
Step: 1 Unlock

Question Has Been Solved by an Expert!
Get step-by-step solutions from verified subject matter experts
Step: 2 Unlock
Step: 3 Unlock