

Question: Please help with the 3 plots and 3 summary data frames to answer 2 questions. Use R studio. I have an example below. left_company left_company
Please help with the 3 plots and 3 summary data frames to answer 2 questions. Use R studio. I have an example below.
| left_company | left_company | department | job_level | salary | weekly_hours | business_travel | yrs_at_company | yrs_since_promotion | previous_companies | job_satisfaction | performance_rating | marital_status | miles_from_home |
| Yes | Yes | Sales | Director | 118680.7 | 56 | Rarely | 6 | 0 | 5 | Very High | Meets Expectations | Single | 1 |
| No | No | Sales | Senior Manager | 85576.44 | 42 | Frequently | 10 | 1 | 5 | Medium | Exceeds Expectations | Married | 8 |
| Yes | Yes | Product Development | Associate | 46235.79 | 56 | Rarely | 0 | 0 | 6 | High | Minimally Effective | Single | 2 |
| No | No | IT and Analytics | Director | 117226.8 | 50 | Frequently | 8 | 3 | 1 | High | Exceptional | Married | 3 |
| No | No | Sales | Associate | 36634.73 | 46 | Rarely | 2 | 2 | 2 | Medium | Exceeds Expectations | Married | 2 |
| No | No | Marketing | Senior Manager | 83519.59 | 48 | Frequently | 7 | 3 | 1 | Very High | Meets Expectations | Single | 2 |
| No | No | Marketing | Senior Manager | 88555.65 | 44 | Rarely | 1 | 0 | 3 | Low | Meets Expectations | Married | 3 |
| No | No | Sales | Director | 122280.9 | 47 | Rarely | 1 | 0 | 3 | High | Exceptional | Divorced | 24 |
| No | No | Finance and Operations | Senior Manager | 94642.18 | 50 | Frequently | 9 | 1 | 3 | High | Meets Expectations | Single | 23 |
| No | No | Product Development | Director | 124537.9 | 51 | Rarely | 7 | 7 | 3 | High | Exceeds Expectations | Married | 27 |

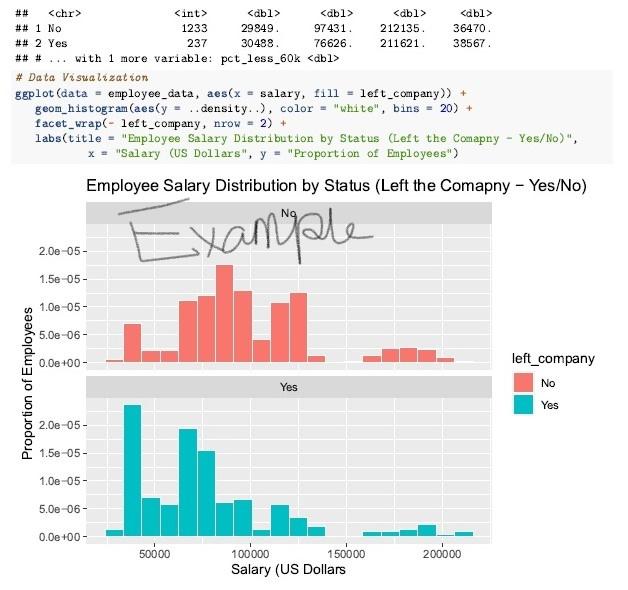
While importing the data csv file, the data type may not match with the data type given above. Please convert them to appropriate data type, before doing any analysis Exploratory Data Analysis Executives at this company have hired you as a data science consultant to identify the factors that lead to employees leaving their company. They would like for you to do an initial data analysis that is able to provide the insights on the likelihood of an employee leaving their company to make recommendations on how to minimize this behavior. Specifically, the broad questions that the executive team is trying to answer include: 1. What are the factors that contribute to employees leaving the company based on summary statistics? 2. Without running any predictive models, just by using plots, can you provide insights for the top management? The goal of your analysis should be discovering which variables drive the differences between employees who do and do not leave the company. You must think of at least 6 relevant questions that explore the relationship between left_company and the other variables in the employee data set. You must answer cach question and provide supporting data summaries with either a summary data frane (tising dplyr/tidyr) or a plot (using ggplot) or both. In total, you must have a minimum of 3 plots and 3 summary data frames for the exploratory data analysis section. Among the plots you produce, you must have at least 3 different types (ex box plot, bar chart, histogram, heat map, etc...) See the example question below. Is there a relationship between employees leaving the company and their current salary? Answer: Yes, the data indicates that employees who leave the company tend to have lower salaries than employees who do not. Among the 237 employees that left the company, the average wage was $76,625. The pay is over $20,000 less than the average salary of employees who did not leave the company. Among the employees who did not leave the company, only 10% have a salary that is less than or equal to $60,000. When looking at employees who did leave the company, this increases to 34%. # Summary Table employee_data %>% group_by (left_company) %>% summarise(n_employees = n(), min_salary - min (salary), avg_salary - mean (salary), max_salary = max (salary), sd_salary + sd (salary), pct_less_60k - mean (salary
Step by Step Solution
There are 3 Steps involved in it

Get step-by-step solutions from verified subject matter experts