

Question: Please help with the below question using the given tables Example: If Z=1.96, then P(0-Z)=0.4750 0.4750 14.1 Normal distribution tables 0 1.96 0.01 0.02 0.03
Please help with the below question using the given tables
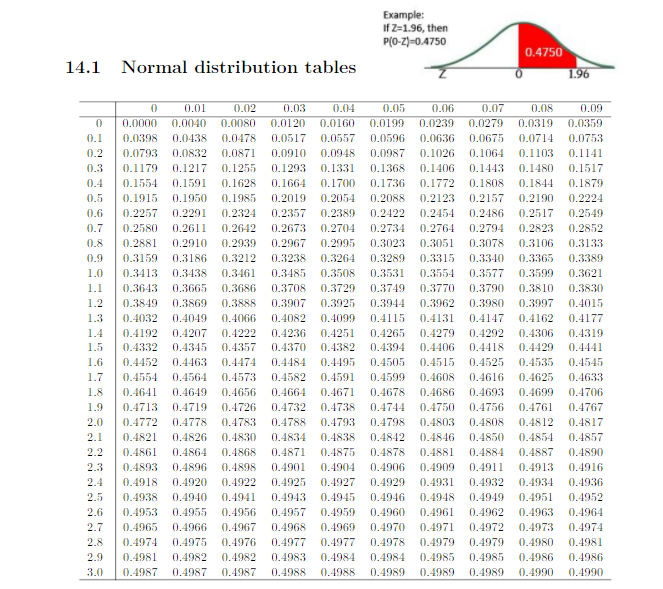
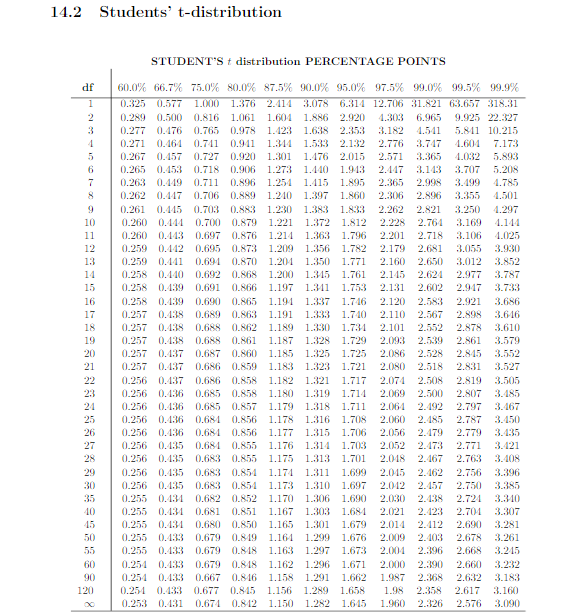
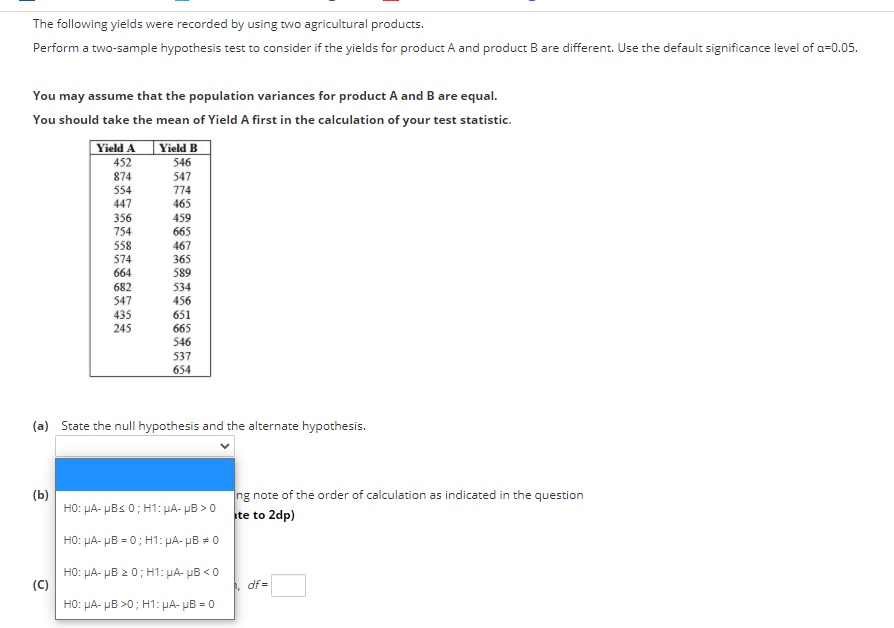
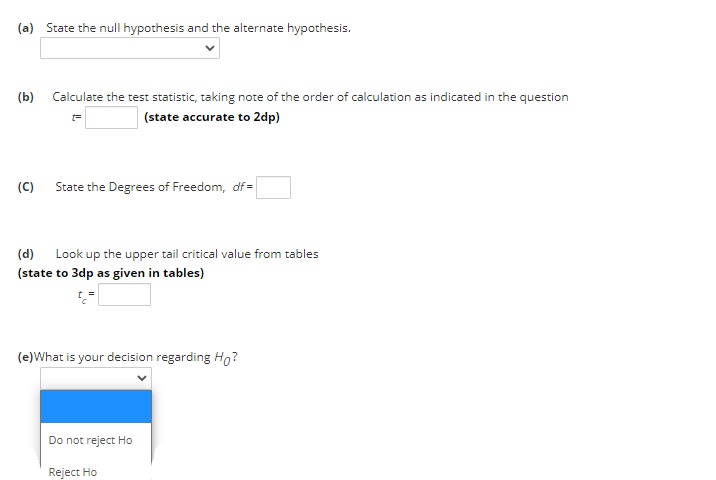
Example: If Z=1.96, then P(0-Z)=0.4750 0.4750 14.1 Normal distribution tables 0 1.96 0.01 0.02 0.03 0.04 0.05 0.06 0.07 0.08 0.09 0 0.0000 0.0040 0.0080 0.0120 0.0160 0.0199 0.0239 0.0279 0.0319 0.0359 0. 1 0.0398 0.0438 0.0478 0.0517 0.0557 0.0596 0.0636 0.0675 0.0714 0.0753 0.2 0.0793 0.0832 0.0871 0.0910 0.0948 0.0987 0.1026 0.1064 0.1103 0.1141 0.3 0.1179 0.1217 0.1255 0.1293 0.1331 0.1368 0.1406 0.1443 0.1480 0.1517 0.4 0.1554 0.1591 0.1628 0.1664 0.1700 0.1736 0.1772 0.1808 0.1844 0.1879 0.5 0.1915 0.1950 0.1985 0.2019 0.2054 0.2088 0.2123 0.2157 0.2190 0.2224 0.6 0.2257 0.2291 0.2324 0.2357 0.2389 0.2422 0.2454 0.2486 0.2517 0.2549 0.7 0.2580 0.2611 0.2642 0.2673 0.2704 0.2734 0.2764 0.2794 0.2823 0.2852 D.8 0.2881 0.2910 0.2939 0.2967 0.2995 0.3023 0.3051 0.3078 0.3106 0.3133 0.9 0.3159 0.3186 0.3212 0.3238 0.3264 0.3289 0.3315 0.3340 0.3365 0.3380 1.0 0.3413 0.3438 0.3461 0.3485 0.3508 0.3531 0.3554 0.3577 0.3599 0.3621 1.1 0.3643 0.3665 0.3686 0.3708 0.3720 0.3749 0.3770 0.3790 0.3810 0.3830 1.2 0.3849 0.3869 0.3888 0.3907 0.3925 0.3944 0.3962 0.3980 0.3997 0.4015 1.3 0.4032 0.4049 0.4066 0.4082 0.4099 0.4115 0.4131 0.4147 0.4162 0.4177 1.4 0.4192 0.4207 0.4222 0.4236 0.4251 0.4265 0.4279 0.4292 0.4306 0.4310 1.5 0.4332 0.4345 0.4357 0.4370 0.4382 0.4394 0.4406 0.4418 0.4429 0.4441 1.6 0.4452 0.4463 0.4474 0.4484 0.4495 0. 4505 0.4515 0.4525 0.4535 0.4545 1.7 0. 4554 0.4564 0.4573 0.4582 0.4591 0.4599 0.4608 0.4616 0.4625 0.4633 1.8 0.4641 0.4649 0.4656 0.4664 0.4671 0.4678 0.4686 0.4693 0.4699 0.4706 1.9 0.4713 0.4719 0.4726 0.4732 0.4738 0.4744 0.4750 0.4756 0.4761 0.4767 2.0 0.4772 0.4778 0.4783 0.4788 0.4793 0.4798 0.4803 0.4808 0.4812 0.4817 2.1 0.4821 0.4826 0.4830 0.4834 0.4838 0.4842 0.4846 0.4850 0.4854 0.4857 2.2 0.4861 0.4864 0.4868 0.4871 0.4875 0.4878 0.4881 0.4884 0.4887 0.4890 2.3 0.4893 0.4896 0.4898 0.4901 0.4904 0.4906 0.4909 0.4911 0.4913 0.4916 2.4 0.4918 0.4920 0.4922 0.4925 0.4927 0.4929 0.4931 0.4932 0.4934 0.4936 2.5 0.4938 0.4940 0.4941 0.4943 0.4945 0.4946 0.4948 0.4949 0.4951 0.4952 2.6 0.4953 0.4955 0.4956 0.4957 0.4959 0.4960 0.4961 0.4962 0.4963 0.4964 2.7 0.4965 0.4966 0.4967 0.4968 0.4969 0.4970 0.4971 0.4972 0.4973 0.4974 2.F 0.4974 0.4975 0.4976 0.4977 0.4977 0.4978 0.4979 0.4979 0.4980 0.4981 2.0 0.4981 0.4982 0.4982 0.4983 0.4984 0.4984 0.4985 0.4985 0.4986 0.4986 3.0 0.4987 0.4987 0.4987 0.4988 0.4988 0.4989 0.4989 0.4989 0.4990 0.499014.2 Students' t-distribution STUDENT'S f distribution PERCENTAGE POINTS df 60.0% 66.7% 75.0% 80.0 87.5% 90.0% 95.0% 97.5% 99.0% 99.5% 99.9% 0.325 0.577 1.000 1.376 2.414 3.078 6.314 12.706 31.821 63.657 318231 0.289 0.500 0.816 1.061 1.604 1.886 2.920 4.303 6.965 9.925 22.327 0.277 0.476 0.765 0.978 1.423 1.638 2.353 3.182 4.541 5.841 10.215 0.271 0.464 0.741 0.941 1.314 1.533 2.132 2.776 3.747 4.604 7.173 0.267 0.457 0.727 0.920 1.201 1.476 2.015 2.571 3.365 4.032 5.893 0.265 0.453 0.718 0.906 1.273 1.440 1.943 2.147 3.143 3.707 5.208 0.263 0.449 0.711 0.896 1.254 1.415 1.895 2.365 2.998 3.499 4.785 0.262 0.447 0.706 0.889 1.240 1.397 1.860 2.306 2.896 3.355 4.501 0.261 0.445 0.703 0.883 1.230 1.383 1.833 2.262 2.821 3.250 1.297 10 0.260 0.414 0.700 0.879 1.221 1.372 1.812 2.228 2.764 3.169 1.144 11 (.260 0.443 0.697 0.876 1.214 1.363 1.796 2.201 2.718 3.106 4.025 12 0.259 0.442 0.695 0.873 1.209 1356 1.782 2.179 2.681 3.055 3.930 0.259 0.441 0.694 0.870 1.204 1350 1.771 2.160 2.650 3.012 3.852 14 (1.258 0.440 0.692 0.868 1.200 1.345 1.761 2.145 2.624 2.977 3.787 15 0.258 0.4:39 0.691 0.866 1.197 1341 1.753 2.131 2.602 2.917 3.7353 16 0.258 0.439 0.690 0.865 1.194 1.337 1.746 2.120 2.583 2.921 3.686 17 (1257 0.438 0.689 0.863 1.191 1 333 1.740 2.110 2.567 2.898 3.646 18 (1.257 0.438 0.688 0.862 1.189 1.330 1.734 2.101 2.552 2.878 3.610 19 0.257 0.438 0.688 0.861 1.187 1.328 1.729 2.093 2.539 2.861 3.579 20 0.257 0.437 0.687 70.860 1.185 1325 1.725 2.086 2.528 2.845 3.552 21 (0.257 0.437 0.686 0.859 1.183 1.323 1.721 2080 2.518 2.831 3.527 22 0.256 0.437 0.686 0.858 1.182 1.321 1.717 2.074 2.508 2.819 3.505 0.256 0.436 0.685 0.858 1.180 1.419 1.714 2.069 2.500 2.807 3.485 24 0.256 0.436 0.685 0.857 1.179 1.318 1.711 2.064 2.192 2.797 3.467 25 0.256 0.436 0.684 0.856 1.178 1.316 1.708 2.060 2.485 2.787 3.450 26 0.256 0.436 0.684 0.856 1.177 1.315 1.706 2.056 2.479 2.779 3.4335 27 0.256 0.435 0.684 0.855 1.176 1.314 1.703 2.052 2.473 2.771 3.421 28 0.256 0.435 0.683 0.855 1.175 1313 1.701 2.048 2. 167 2.763 3.408 29 0.256 0.435 0.683 3 0.854 1.174 1.311 1.699 2.045 2. 162 2.756 3.396 30 0.256 0.435 0.683 0.854 1.173 1.310 1.697 2.042 2. 157 2.750 3.385 35 0.255 0.434 0.682 0.852 1.170 1.306 1.690 2.030 2.1:38 2.724 3.340 40 0.255 0.434 0.681 0.851 1.167 1.303 1.684 2.021 2. 123 2.704 3.307 45 0.255 0.434 0.680 0.850 1.165 1.301 1.679 2.014 2.412 2.690 3.281 50 0.255 0.433 0.679 0.849 1.164 1.299 1.676 2.009 2.403 2.678 3.261 55 0.255 0.433 0.679 0.848 1.163 1.297 1.673 2.004 2.396 2.668 3.245 60 0.254 0.433 0.679 0.848 1.162 1.296 1.671 2.000 2.390 2.660 3.232 0.254 0.433 0.667 0.846 1.158 1.291 1.662 1.987 2.:368 2.6:12 3.183 120) 0.254 0.433 0.677 0.845 1.156 1.289 1.658 1.98 2.358 2.617 3.160 (.254 0.431 0.674 0.842 1.150 1.282 1.645 1.960 2.326 2.576 3.090The following yields were recorded by using two agricultural products. Perform a two-sample hypothesis test to consider if the yields for product A and product B are different. Use the default significance level of a=0.05. You may assume that the population variances for product A and B are equal. You should take the mean of Yield A first in the calculation of your test statistic. Yield A Yield B 452 546 874 547 554 774 447 465 356 459 754 665 558 467 574 365 664 589 682 534 547 456 435 651 245 665 546 537 654 (a) State the null hypothesis and the alternate hypothesis. (b) ng note of the order of calculation as indicated in the question HO: HA- UBS 0 ; H1: JA- HB > 0 te to 2dp) HO: HA- HB = 0 ; H1: HA- HB = 0 HO: HA- HB 2 0 ; H1: HA- PB 0 ; H1: HA- UB = 0(a) State the null hypothesis and the alternate hypothesis. (b) Calculate the test statistic, taking note of the order of calculation as indicated in the question (state accurate to 2dp) (C) State the Degrees of Freedom, df= (d) Look up the upper tail critical value from tables (state to 3dp as given in tables) (e)What is your decision regarding Ho? Do not reject Ho Reject Ho
Step by Step Solution
There are 3 Steps involved in it

Get step-by-step solutions from verified subject matter experts