

Question: Please help with the blank fields Refer the following table Focus Metals Inc Comparative Balance Sheet Information November 30 (millions of S) 20172016 Cash Accounts
Please help with the blank fields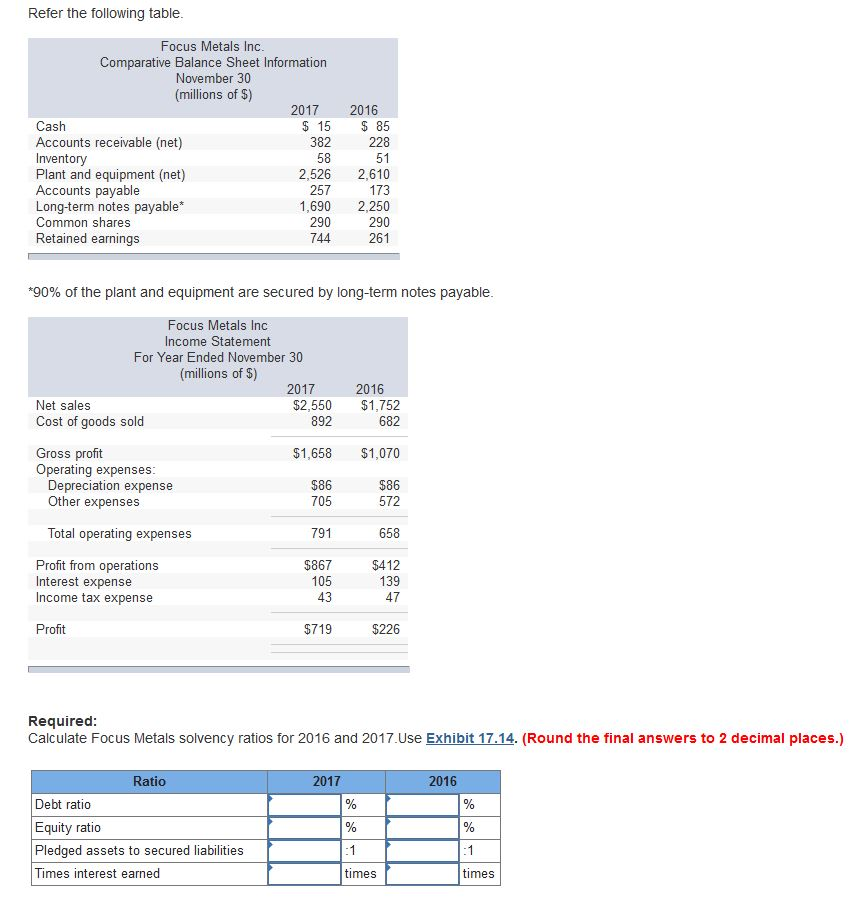
Refer the following table Focus Metals Inc Comparative Balance Sheet Information November 30 (millions of S) 20172016 Cash Accounts receivable (net) Inventory Plant and equipment (net) Accounts payable Long-term notes payable Common shares Retained earnings $ 15 85 228 51 2,526 2,610 173 1,690 2,250 290 261 382 58 257 290 744 *90% of the plant and equipment are secured by long-term notes payable Focus Metals Inc Income Statement For Year Ended November 30 (millions of S) 2017 2016 Net sales Cost of goods sold $2,550 $1,752 682 892 Gross profit Operating expenses $1,658 $1,070 $86 705 $86 572 Depreciation expense Other expenses Total operating expenses 791 658 Profit from operations Interest expense Income tax expense $867 105 43 $412 139 47 Profit $719 $226 Required Calculate Focus Metals solvency ratios for 2016 and 2017.Use Exhibit 17.14. (Round the final answers to 2 decimal places.) Ratio 2017 2016 Debt ratio Equity ratic Pledged assets to secured liabilities Times interest earned times times
Step by Step Solution
There are 3 Steps involved in it

Get step-by-step solutions from verified subject matter experts