

Question: Please help with the following python questions :) For questions 12 and 13, the screenshots show the multiple choice options, which are the same for
Please help with the following python questions :)
For questions 12 and 13, the screenshots show the multiple choice options, which are the same for all parts of the respective questions.
Thank you!
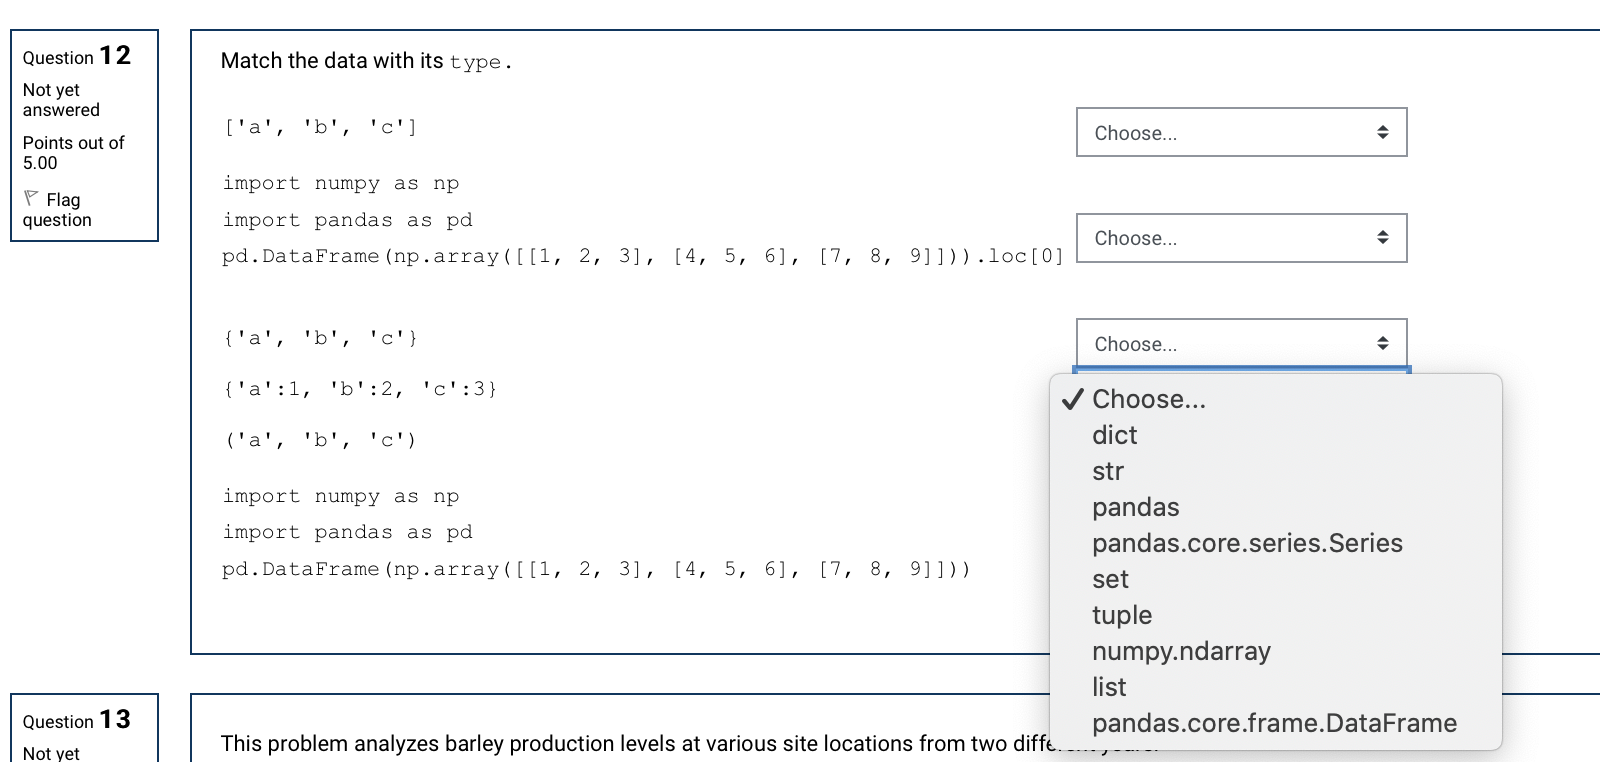
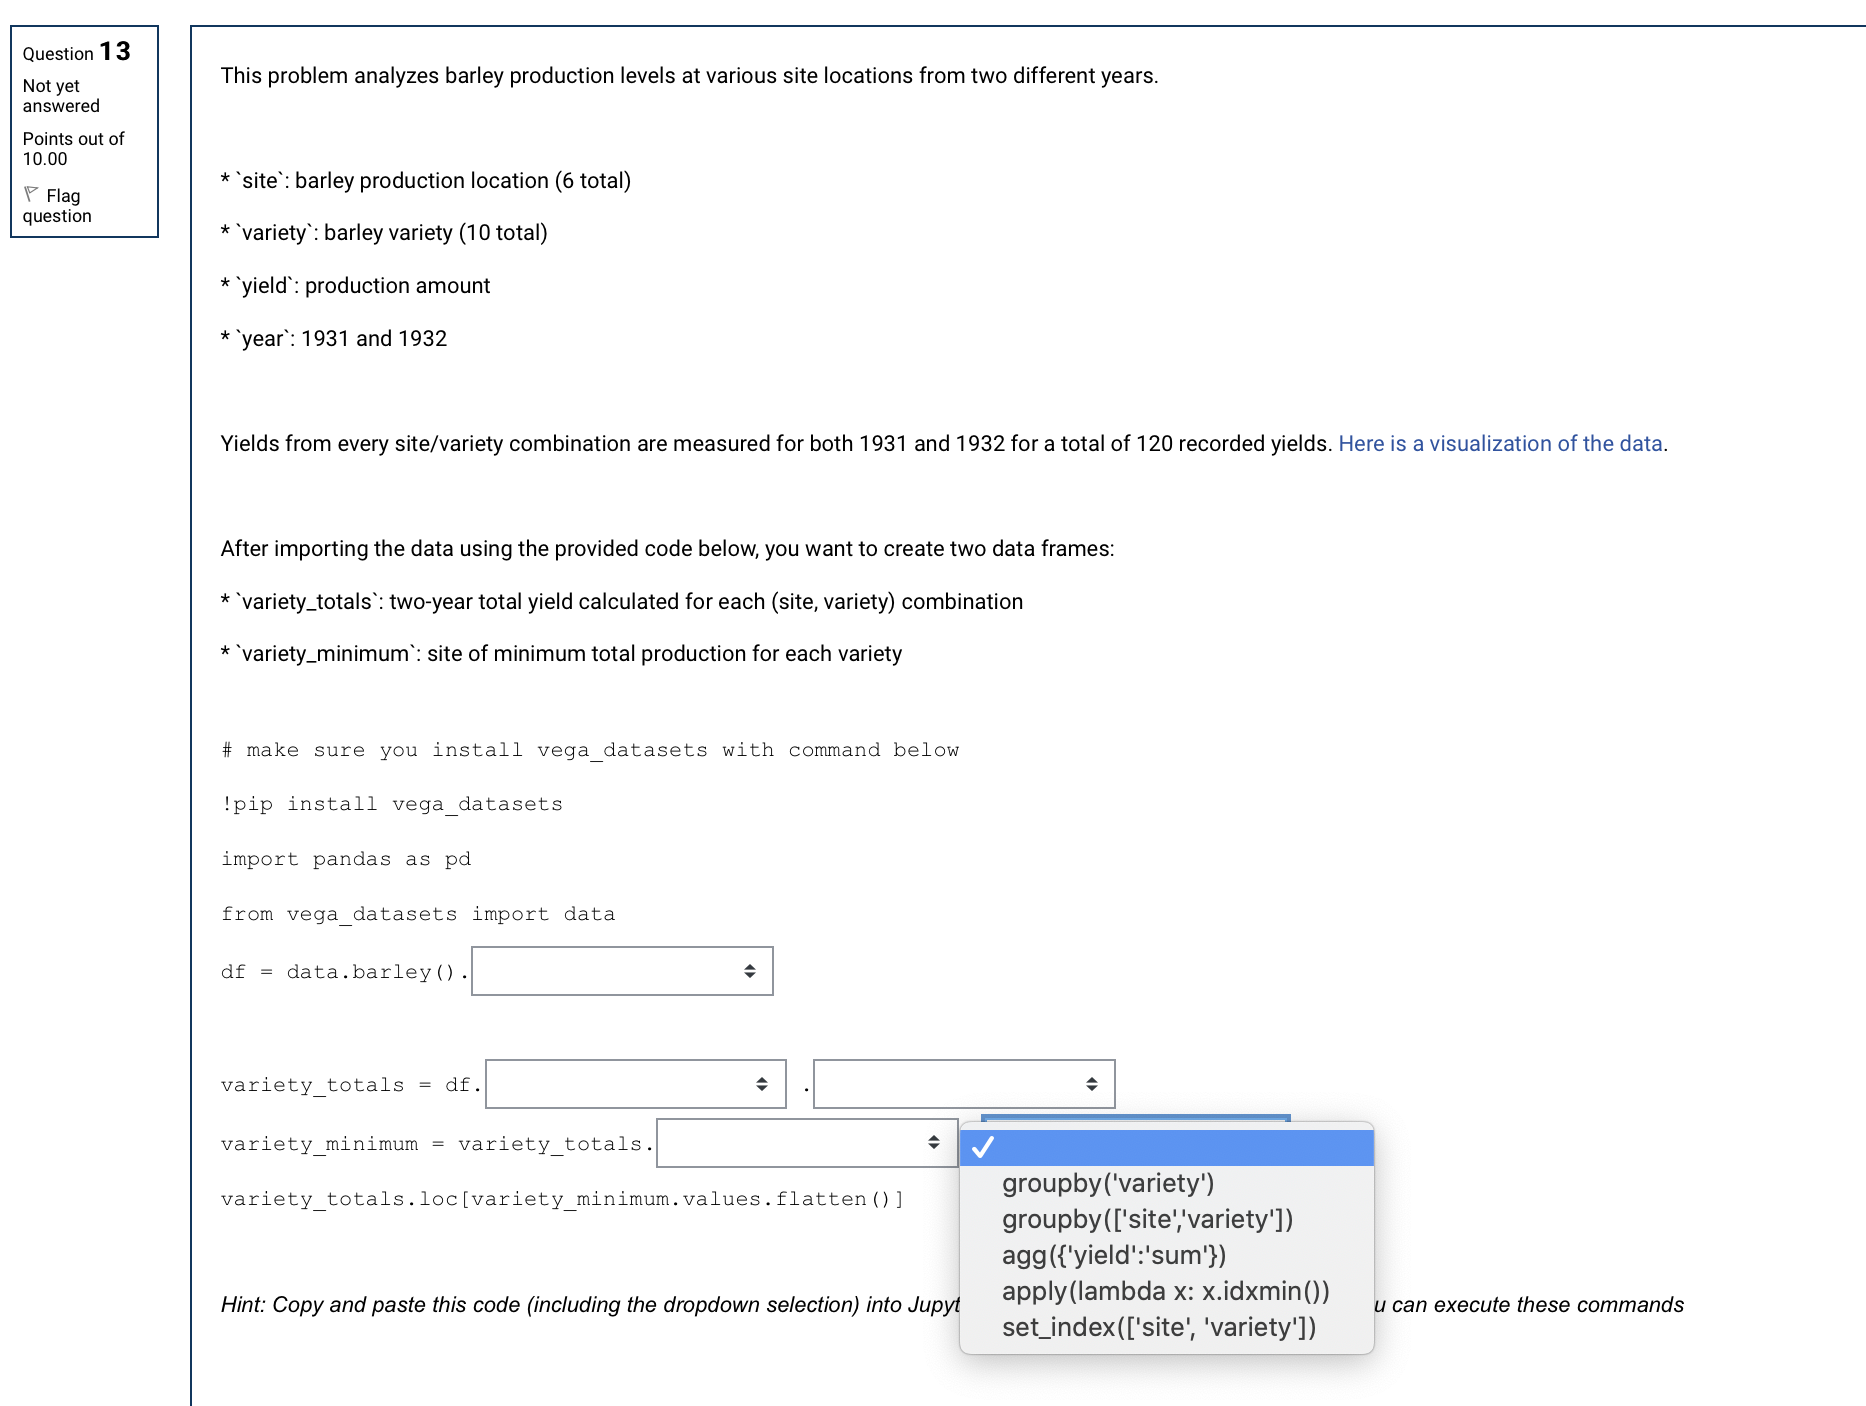
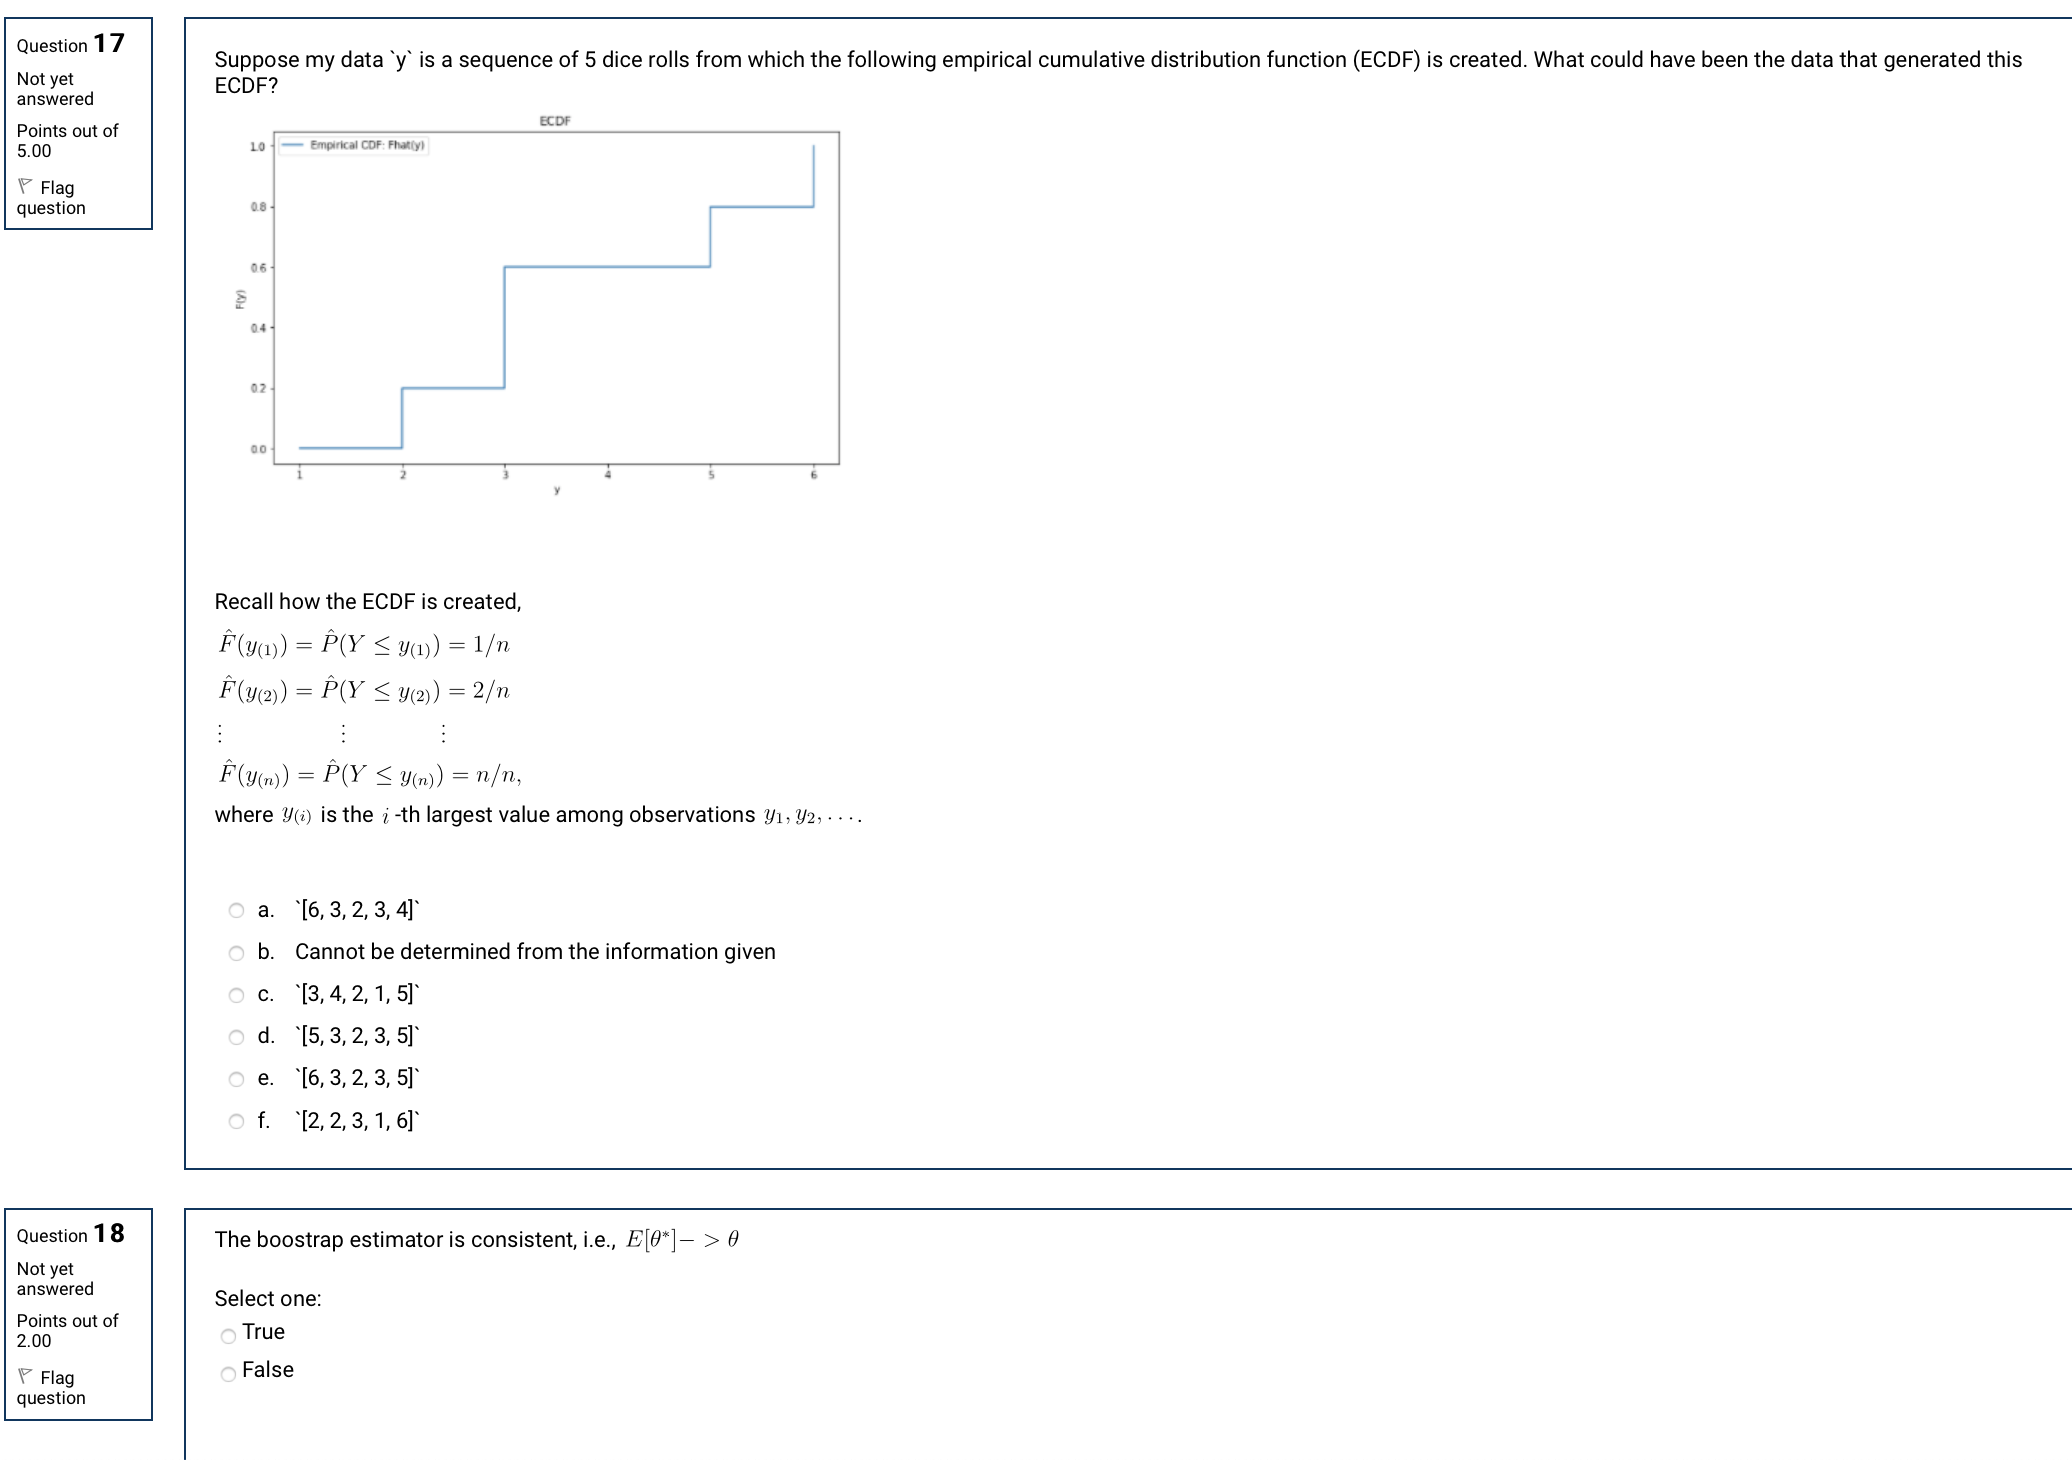
Question 12 Match the data with its type . Not yet answered ['a', 'b', 'c'l Points out of Choose... 5.00 import numpy as np Flag question import pandas as pd Choose... pd . DataFrame (np . array ( [ [1, 2, 3] , [4, 5, 6], [7, 8, 9]])) . loc[0] {'a', 'b', 'c'} Choose... ('a' :1, 'b' :2, 'c' :3} Choose... ('a', 'b', 'c') dict str import numpy as np pandas import pandas as pd pandas.core.series.Series pd . DataFrame (np . array ( [ [1, 2, 3], [4, 5, 6], [7, 8, 9]])) set tuple numpy.ndarray list Question 13 pandas.core.frame.DataFrame Not yet This problem analyzes barley production levels at various site locations from two diffeQuestion 13 Not yet This problem analyzes barley production levels at various site locations from two different years. answered Points out of 10.00 Flag *"site : barley production location (6 total) question * "variety': barley variety (10 total) `yield': production amount * "year: 1931 and 1932 Yields from every site/variety combination are measured for both 1931 and 1932 for a total of 120 recorded yields. Here is a visualization of the data. After importing the data using the provided code below, you want to create two data frames: *"variety_totals": two-year total yield calculated for each (site, variety) combination * "variety_minimum: site of minimum total production for each variety # make sure you install vega_datasets with command below !pip install vega_datasets import pandas as pd from vega_datasets import data df = data . barley () . variety_totals = df. variety_minimum = variety_totals. variety_totals . loc[variety_minimum. values . flatten ( ) ] groupby('variety') groupby (['site','variety']) agg ({'yield':'sum'}) Hint: Copy and paste this code (including the dropdown selection) into Jupyt apply (lambda x: x.idxmin()) u can execute these commands set_index (['site', 'variety'])Question 1 7 Not yet answered Points out of 5.00 V Flag question Suppose my data 'y' is a sequence of 5 dice rolls from which the following empirical cumulative distribution function (ECDF) is created. What could have been the data that generated this ECDF? Km u i swam: mm PM an n nu Recall how the ECDF is created, 1701(1)) : PW 5 11(1)) : 1/71 Fm) : 150' S 9(2)) : 2/\" 15001)) = F'O' S mm) = \"/11, where 90') is the i-th largest value among observations y] , 312, , . -. .'M&Z&W gm Cannot be determined from the information given 0. '[3, 4, 2, 1, 51' d. '[5, 3, 2, 3, 51' e. '[6, 3, 2, 3, 51' f. '[2, 2, 3, 1, 61' Question 1 8 Not yet answered Points out of 2.00 V Flag question The boostrap estimator is consistent, i.e., E[6*]7 > 9 Select one: True False
Step by Step Solution
There are 3 Steps involved in it

Get step-by-step solutions from verified subject matter experts