

Question: Please help with the following questions listed below 1. Consider the following measures: mean, median, variance, standard deviation, percenh'le. a) Which measures utilize relative position
Please help with the following questions listed below
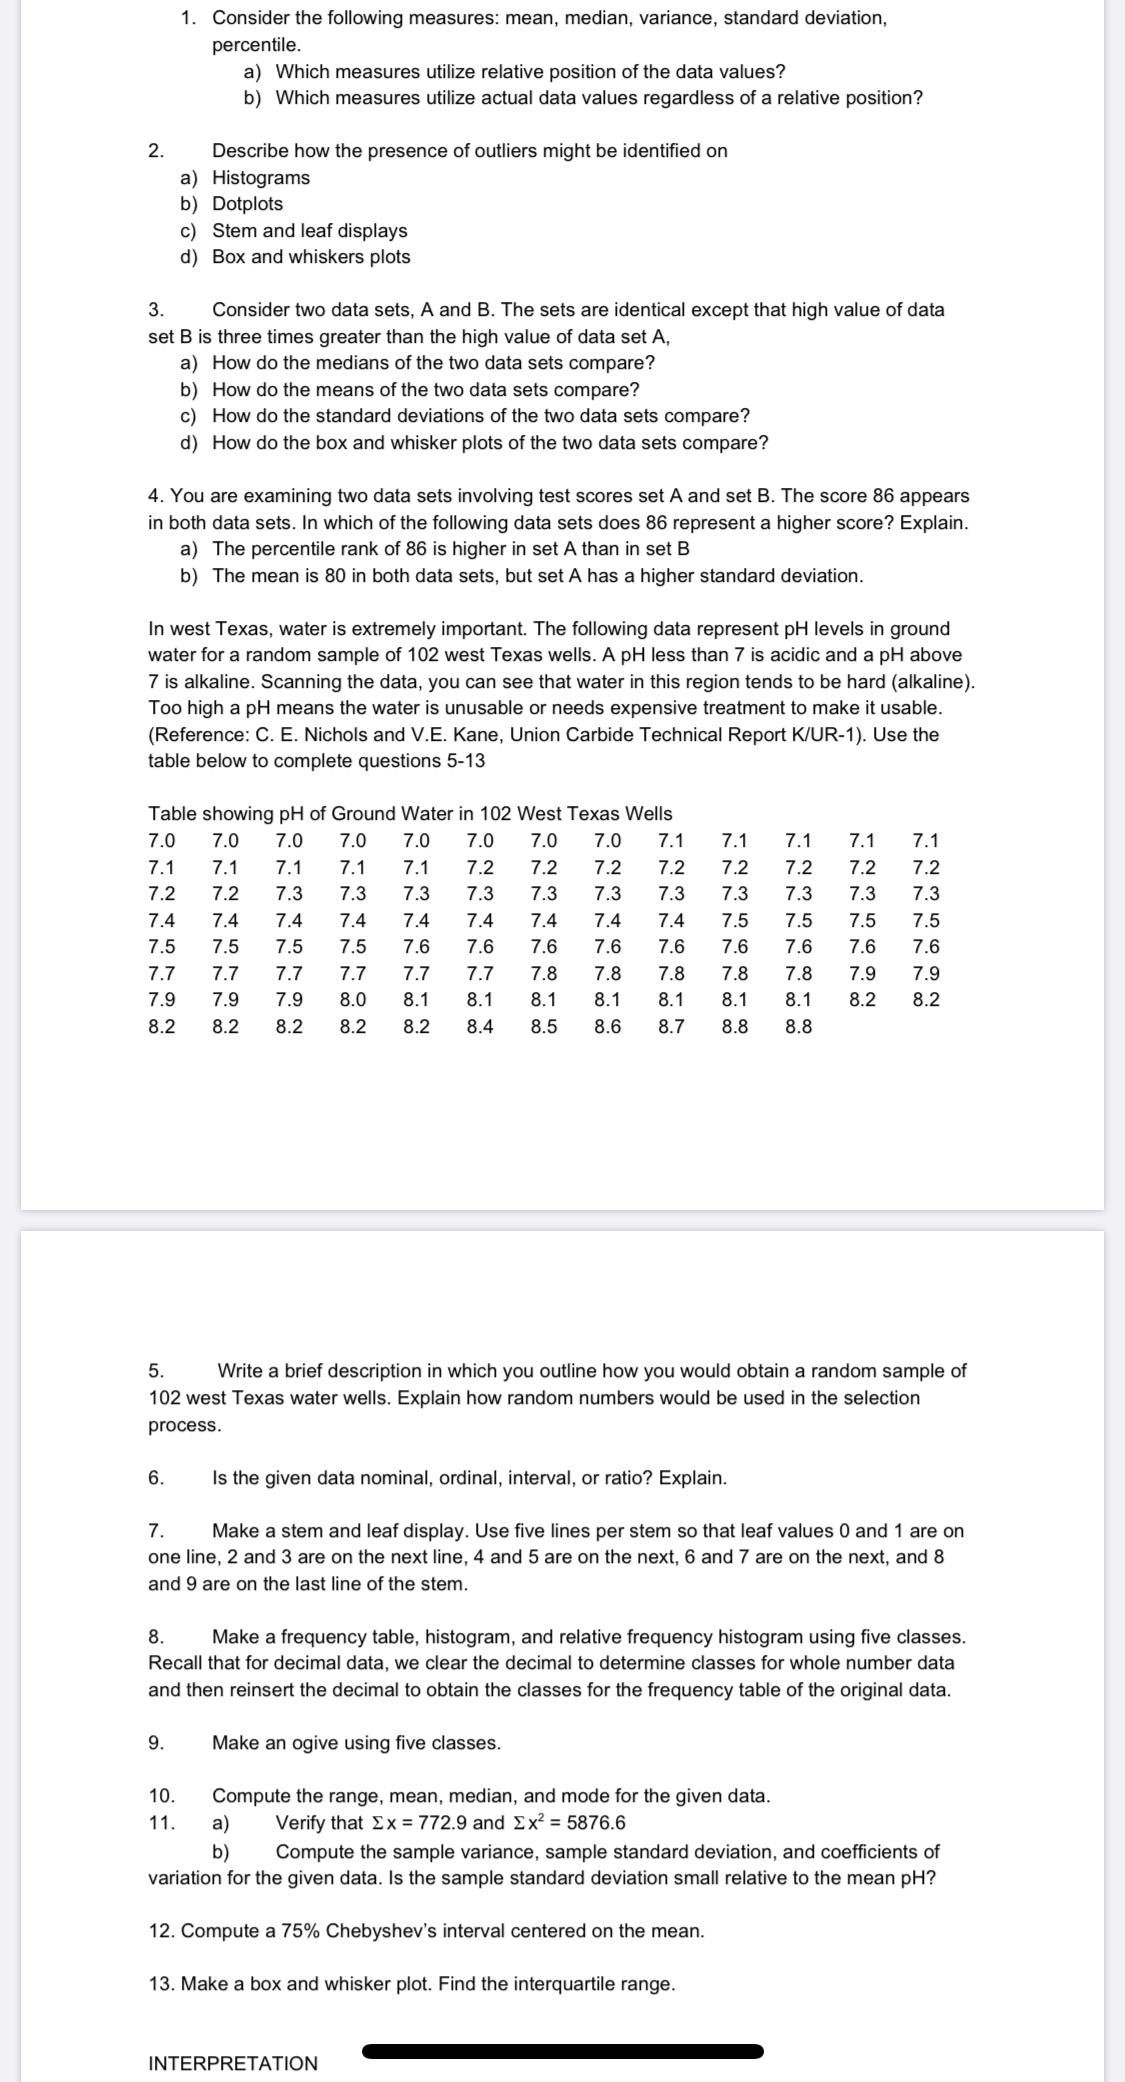
1. Consider the following measures: mean, median, variance, standard deviation, percenh'le. a) Which measures utilize relative position of the data values? b) Which measures utilize actual data values regardless of a relative position? 2. Describe how the presence of outliers might be identied on a) Histograms b) Dotplots c) Stem and leaf displays :1) Box and whiskers plots 3. Consider two data sets, A and B. The sets are identical except that high value of data set B is three times greater than the high value of data set A. a) How do the medians of the two data sets compare? b) How do the means of the two data sets compare? 0) How do the standard deviations of the two data sets compare? d) How do the box and whisker plots of thetwo data sets compare? 4. You are examining two data sets involving test scores set A and set E. The score 86 appears in both data sets. In which of the following data sets does 86 represent a higher score'lI Explain. a) The peroenle rank of 86 is higher in set A than in set B b) The mean is 80 in both data sets. but setA has a higher standard deviation. In west Texas. water is extremely important. The following data represent pH levels in ground water for a random sample of 102 west Texas wells. A pH less than 7 is acidic and a pH above 7 is alkaline. Scanning the data, you can see that water in this region tends to be hard (alkaline). Too high a pH means the water is unusable or needs expensive treatment to make it usable. (Reference: C. E. Nichols and V.E. Kane, Union Carbide Technical Report K/UR-1). Use the table below to complete questions 5-13 Table showing pH of Ground Water in 102 West Texas Wells 7.0 7.0 7.0 7.0 7.0 7.0 7.0 7.0 7.1 7.1 7.1 7.1 7.1 7.1 7.1 7.1 7.1 7.1 7.2 7.2 7.2 7.2 7.2 7.2 7.2 7.2 7.2 7.2 7.3 7.3 7.3 7.3 7.3 7.3 7.3 7.3 7.3 7.3 7.3 7.4 7.4 7.4 7.4 7.4 7.4 7.4 7.4 7.4 7.5 7.5 7.5 7.5 7.5 7.5 7.5 7.5 7.6 7.6 7.6 7.6 7.6 7.6 7.6 7.6 7.6 7.7 7.7 7.7 7.7 7.7 7.7 7.8 7.8 7.8 7.8 7.8 7.9 7.9 7.9 7.9 7.9 8.0 8.1 8.1 8.1 8.1 8.1 8.1 8.1 8.2 8.2 8.2 8.2 8.2 8.2 8.2 8.4 8.5 8.6 8.7 8.8 8.8 5. Write a brief description in which you outline how you would obtain a random sample of 102 west Texas water wells. Explain how random numbers would be used in the selection process. 6. Is the given data nominal. ordinal, interval. or ratio? Explain. 7. Make a stem and leaf display. Use live lines per stern so that leaf values 0 and 1 are on one line, 2 and 3 are on the next line, 4 and 5 are on the next. 6 and 7 are on the next, and 8 and 9 are on the last line of the stem. 8. Make a frequency table. histogram, and relative frequency histogram using five classes. Recall that for decimal data. we clear the decimal to determine classes for whole number data and then reinsert the decimal to obtain the classes for the frequency table of the original data. 9. Make an ogive using live classes. 10. Compute the range, mean. median, and mode for the given data. 11. a) Verify that Ex = 772.9 and Ex? = 5876.6 b) Compute the sample variance. sample standard deviation. and coefcients of variation forthe given data. Is the sample standard deviation small relative to the mean pH? 12. Compute a 75% Chebyshev's interval centered on the mean. 13. Make a box and whisker plot. Find the interquartile range. INTERPRETATION
Step by Step Solution
There are 3 Steps involved in it

Get step-by-step solutions from verified subject matter experts