

Question: Please help with the following statistics/regression analysis problem :) 2. I generated n = 1000 random numbers from two specic distributions, and produced the following
Please help with the following statistics/regression analysis problem :)
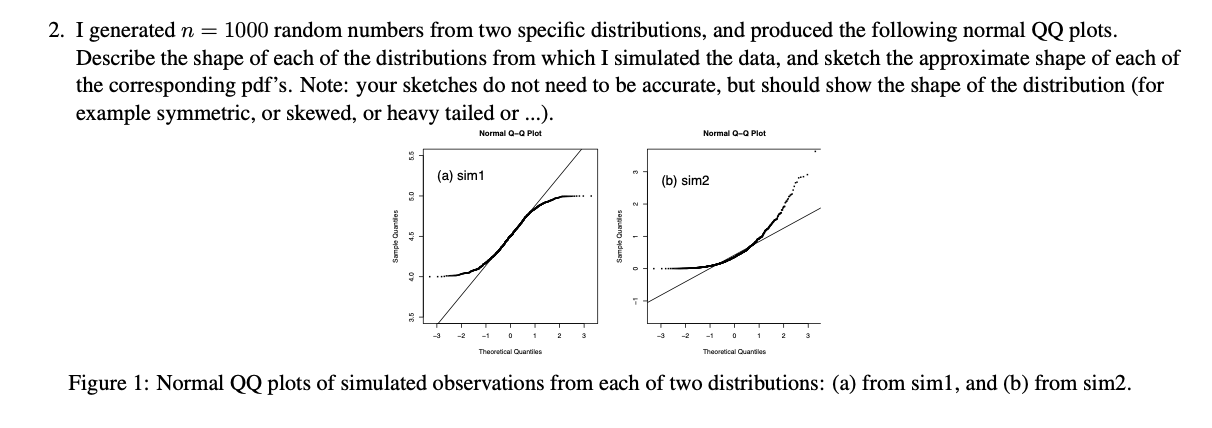
2. I generated n = 1000 random numbers from two specic distributions, and produced the following normal QQ plots. Describe the shape of each of the distributions from which I simulated the data, and sketch the approximate shape of each of the corresponding pdf's. Note: your sketches do not need to be accurate, but should show the shape of the distribution (for example symmetric, or skewed, or heavy tailed or ...). Mama-om Malinda-om Figure 1: Normal QQ plots of simulated observations from each of two distributions: (a) from siml, and (b) from sim2
Step by Step Solution
There are 3 Steps involved in it
1 Expert Approved Answer
Step: 1 Unlock

Question Has Been Solved by an Expert!
Get step-by-step solutions from verified subject matter experts
Step: 2 Unlock
Step: 3 Unlock