

Question: Please help with the incorrect ones thank you. https://www.webassign.net/web/Student/Assignment-Responses/last?dep=23577098 50 - 50 60 40 40 40 30 N 3 30 2 3 30- 2 O
Please help with the incorrect ones thank you.
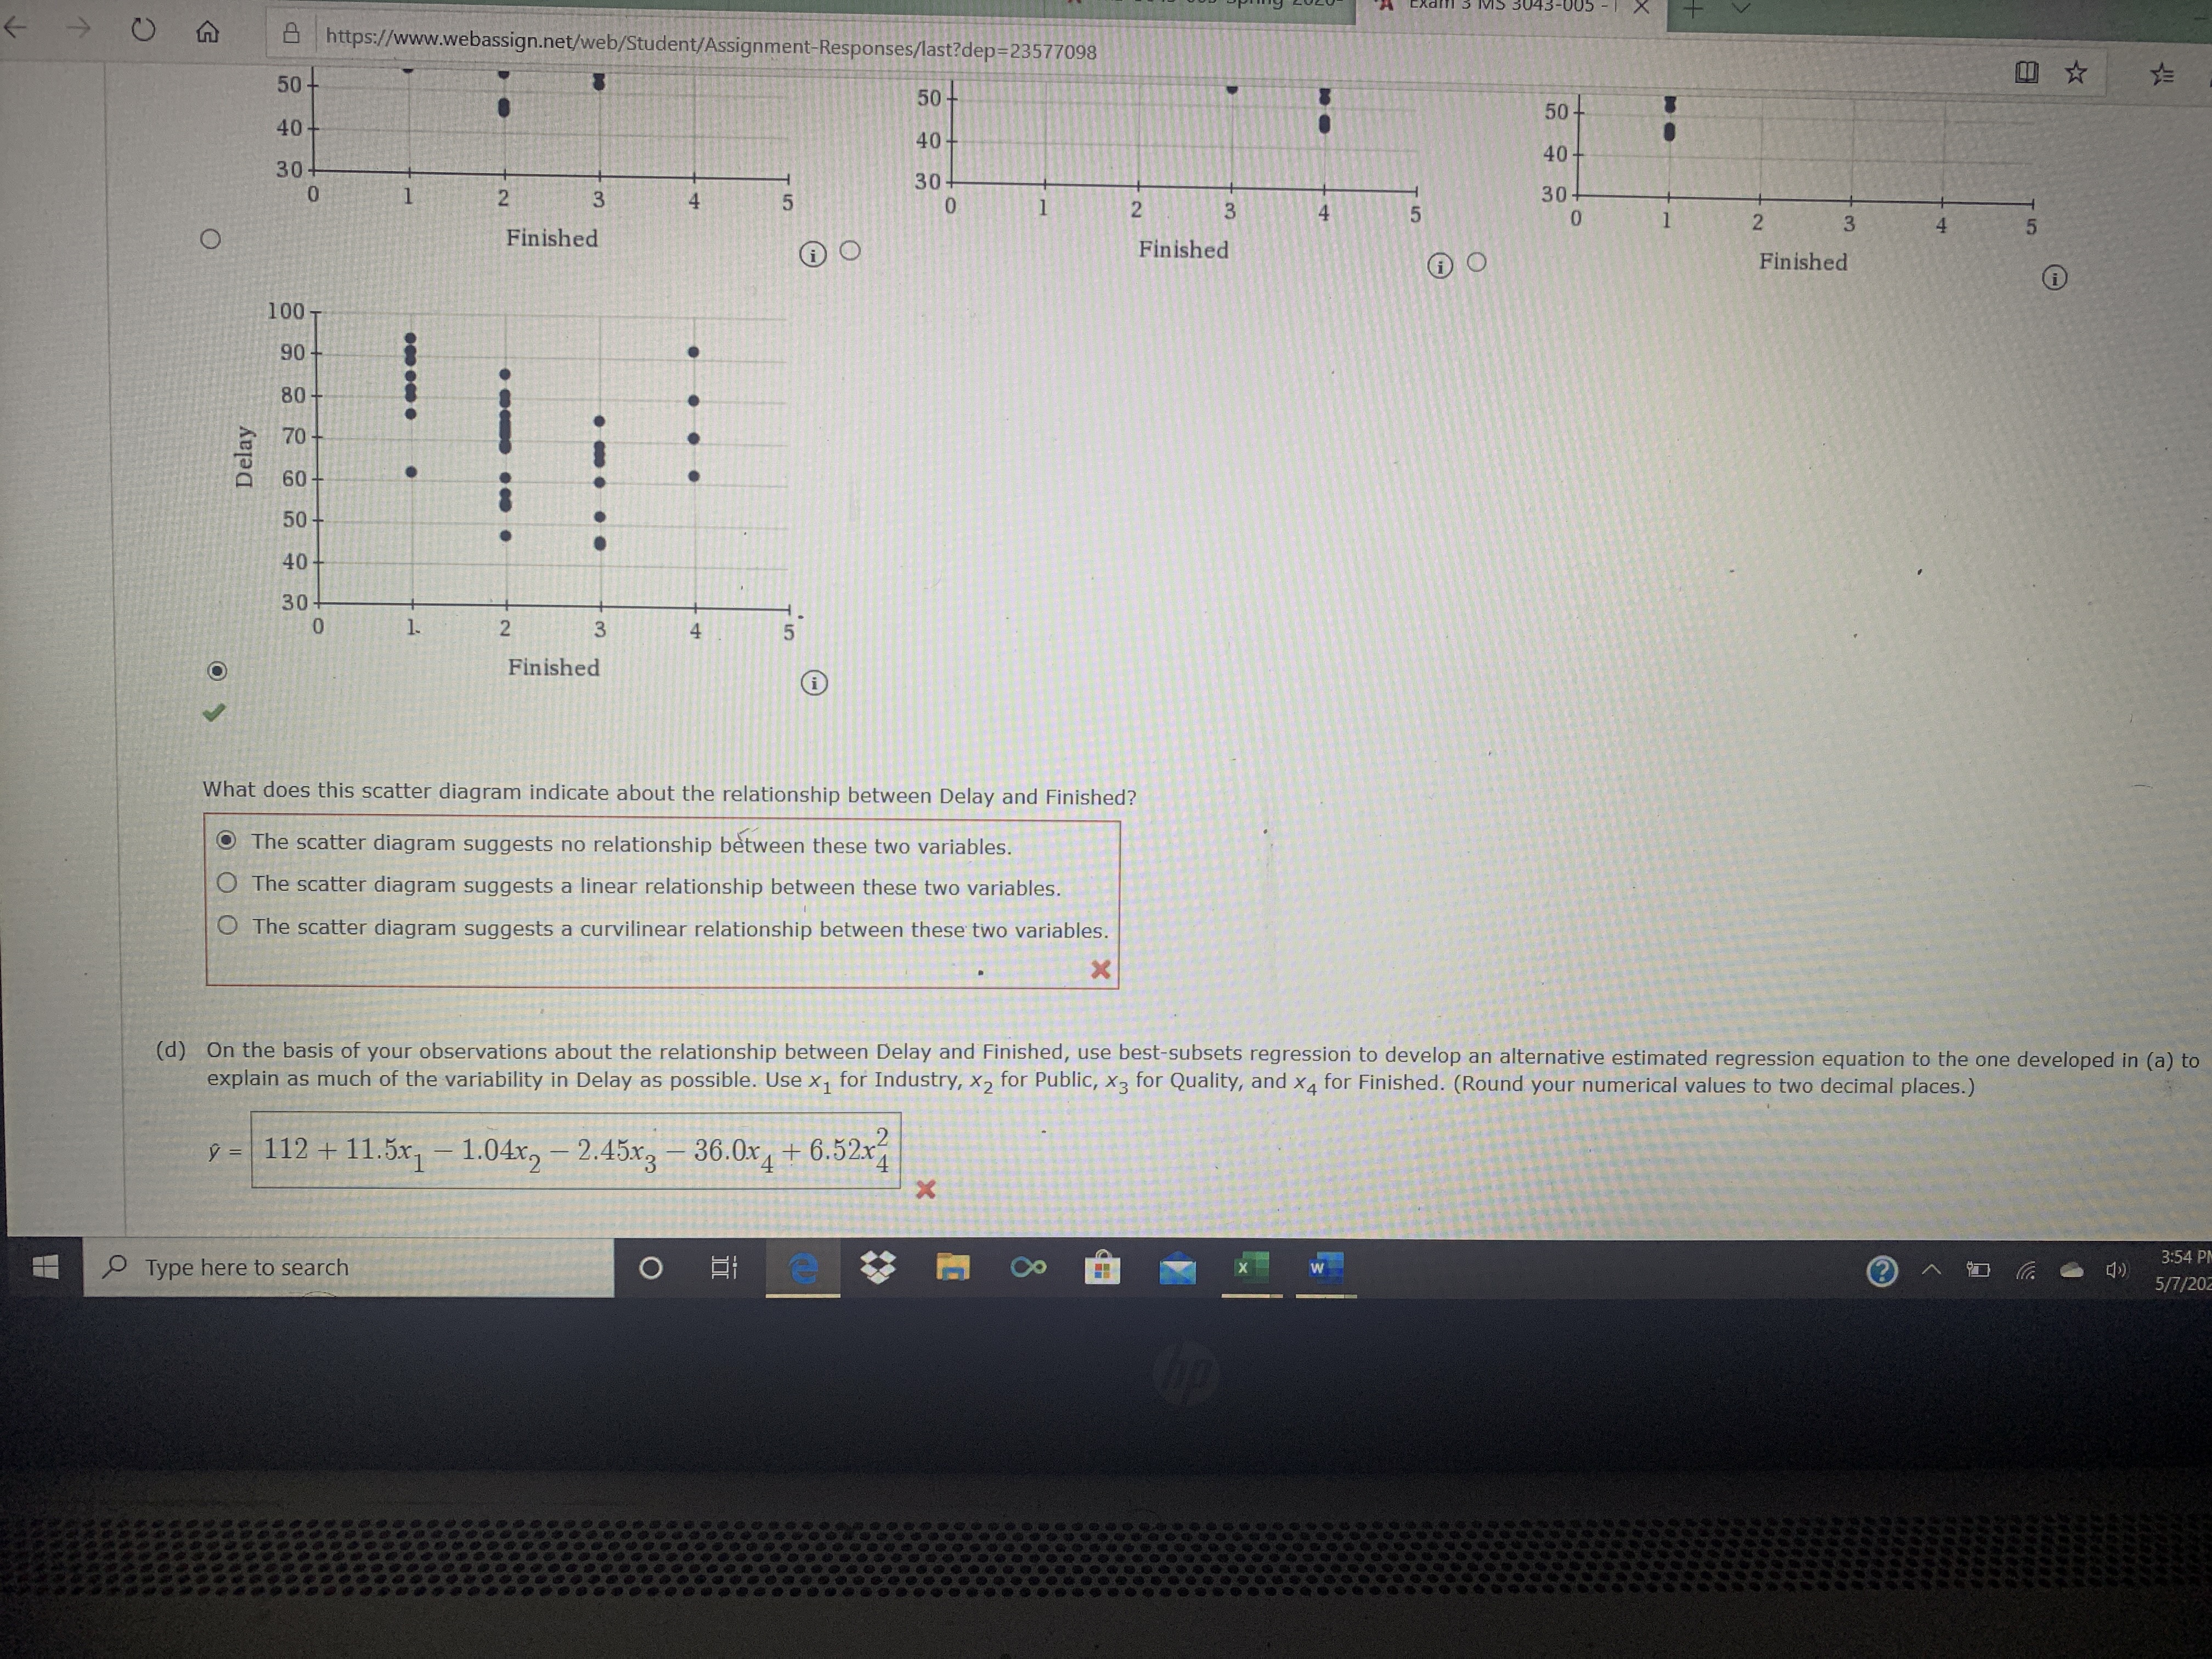
https://www.webassign.net/web/Student/Assignment-Responses/last?dep=23577098 50 - 50 60 40 40 40 30 N 3 30 2 3 30- 2 O Finished 3 4 Finished Finished 100 90 80 Delay 70 60 50 40 30 2 Finished What does this scatter diagram indicate about the relationship between Delay and Finished? The scatter diagram suggests no relationship between these two variables. The scatter diagram suggests a linear relationship between these two variables. The scatter diagram suggests a curvilinear relationship between these two variables. X (d) On the basis of your observations about the relationship between Delay and Finished, use best-subsets regression to develop an alternative estimated regression equation to the one developed in (a) to explain as much of the variability in Delay as possible. Use x] for Industry, x2 for Public, x3 for Quality, and x4 for Finished. (Round your numerical values to two decimal places.) y = 112 + 11.5x, - 1.04x2 - 2.45x3 -36.0x4 + 6.52x X 3:54 Type here to search O e X W 5/7/20
Step by Step Solution
There are 3 Steps involved in it

Get step-by-step solutions from verified subject matter experts