

Question: Please help with the ones I have blank or incorrect!! Or just inform me on how to work through them?? Thank you f. Estimate Bartman's
Please help with the ones I have blank or incorrect!! Or just inform me on how to work through them?? Thank you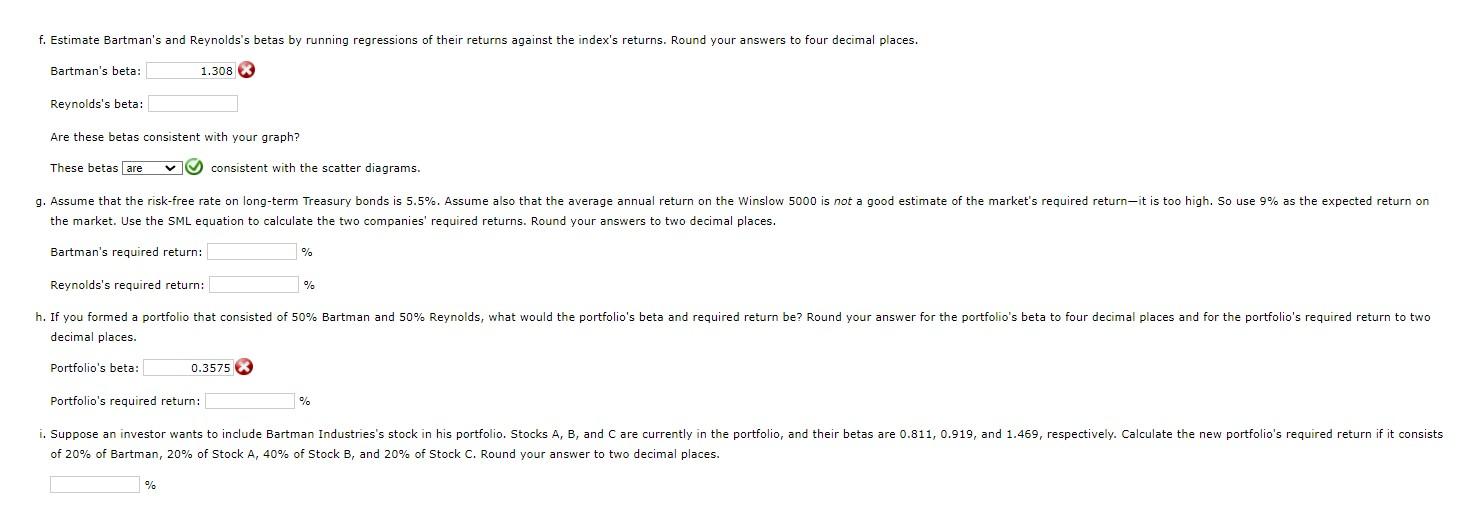
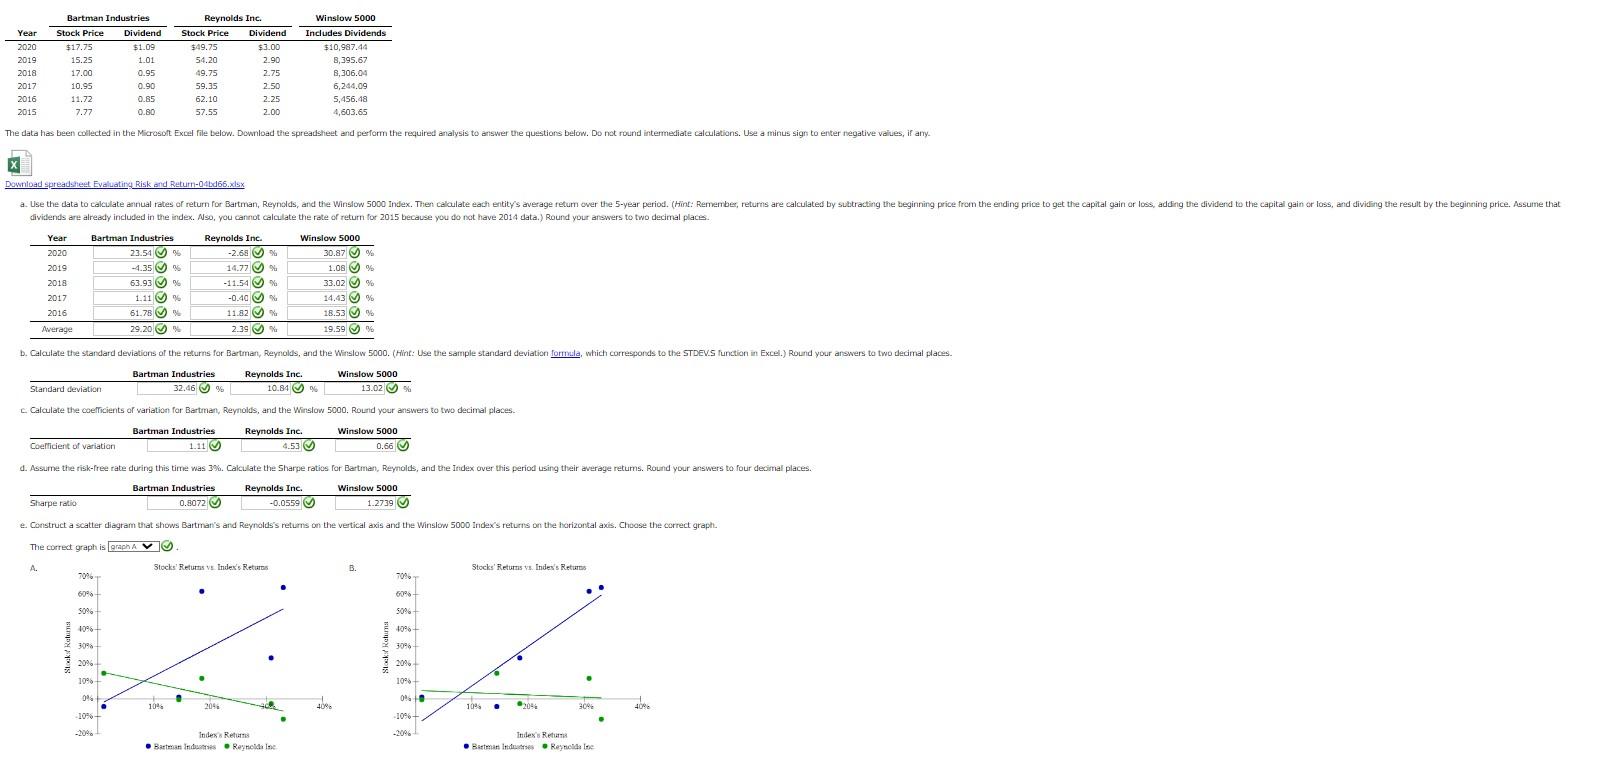
f. Estimate Bartman's and Reynolds's betas by running regressions of their returns against the index's returns. Round your answers to four decimal places. Bartman's beta: Reynolds's beta: Are these betas consistent with your graph? These betas consistent with the scatter diagrams. the market. Use the SML equation to calculate the two companies' required returns. Round your answers to two decimal places. Bartman's required return: Reynolds's required return: decimal places. Portfolio's beta: Portfolio's required return: of 20% of Bartman, 20% of Stock A, 40% of Stock B, and 20% of Stock C. Round your answer to two decimal places. \begin{tabular}{cccccccc} & \multicolumn{2}{c}{ Bartman Industries } & & \multicolumn{2}{c}{ Reynolds Inc. } & & Winslow 5000 \\ \cline { 2 - 3 } \cline { 5 - 7 } Year & Stock Price & Dividend & & Stock Price & Dividend & & Includes Dividends \\ \hline 2020 & $17.75 & $1.09 & & $49.75 & $3.00 & & $10,997.44 \\ 2019 & 15.25 & 1.01 & & 54.20 & 2.90 & & 8,395.67 \\ 2018 & 17.00 & 0.95 & & 49.75 & 2.75 & & 8,306.04 \\ 2017 & 10.95 & 0.90 & & 59.35 & 2.50 & & 6,244.09 \\ 2016 & 11.72 & 0.85 & & 62.10 & 2.25 & & 5,456.48 \\ 2015 & 7.77 & 0.80 & & 57.55 & 2.00 & & 4,603.65 \end{tabular} (inload spreadsheat Evaluatiry Risk and Return-04bd66.xlsX dividends are already included in the index. Aso, you cannot calculate the rate of return for 2015 because you do not have 2014 data.) Round your arowers to two decimal places. c. Calculate the coefrients of variation for Bartman, Reynolds, and the Wirslow 5000 . Round your answers to two decimal places. \begin{tabular}{c|c|c|c} & Bartman Industries & Reynolds Inc. & Winslow 5000 \\ \hline Coelficient of variation & 1.11( & 4.53 & 0.66(Y \end{tabular} d. Assume the risk-free rate during this time was 3\%. Cakulate the Sharpe ratios for Bartman, Reymolds, and the Index over this period using their average retums. Round your answers to four decimal places. \begin{tabular}{|c|r|r|r} & \multicolumn{1}{c}{ Bartman Industries } & Reynolds Inc. & Winslow 5000 \\ \hline Sharpe ratio & 0.8072 & 0.0559 & 1.2739 \\ \cline { 1 - 4 } & & & \end{tabular} e. Construct a scatter diagram that shows Bartmar's and Reynolds's returns on the vertical axis and the Winslow 5000 Indexs returns on the horizontal axis. Choose the correct graph. The correct graph is graph A v
Step by Step Solution
There are 3 Steps involved in it

Get step-by-step solutions from verified subject matter experts