

Question: Please help with the question in the attached screenshot. Question 6 a) An article in The Economist magazine noted that 'the economy's potential to supply
Please help with the question in the attached screenshot.
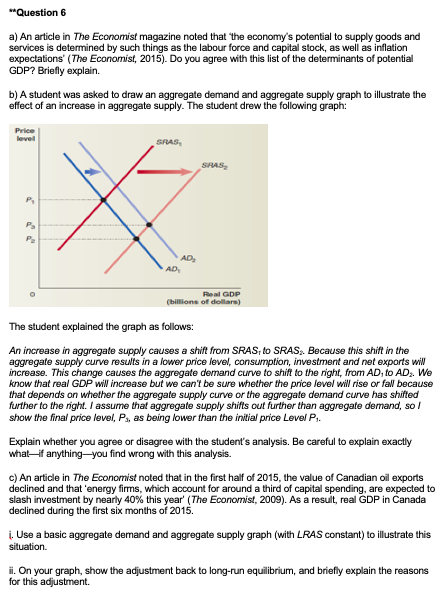
"Question 6 a) An article in The Economist magazine noted that 'the economy's potential to supply goods and services is determined by such things as the labour force and capital stock, as well as inflation expectations' (The Economist, 2015). Do you agree with this list of the determinants of potential GDP? Briefly explain. b) A student was asked to draw an aggregate demand and aggregate supply graph to illustrate the effect of an increase in aggregate supply. The student drew the following graph: Price Level X RAS SHAS AD Real GDP (billions of dollar) The student explained the graph as follows: An increase in aggregate supply causes a shift from SRAS, to SRAS,. Because this shift in the aggregate supply curve results in a lower price level, consumption, investment and net exports will increase. This change causes the aggregate demand curve to shift to the right, from AD, to AD,. We know that real GDP will increase but we can't be sure whether the price level will rise or fall because that depends on whether the aggregate supply curve of the aggregate demand curve has shifted further to the right. I assume that aggregate supply shifts out further than aggregate demand, so / show the final price level, P, as being lower than the initial price Level P. Explain whether you agree or disagree with the student's analysis. Be careful to explain exactly what if anything-you find wrong with this analysis. c) An article in The Economist noted that in the first half of 2015, the value of Canadian oil exports declined and that 'energy firms, which account for around a third of capital spending, are expected to slash investment by nearly 40% this year' (The Economist, 2009). As a result, real GDP in Canada declined during the first six months of 2015. i. Use a basic aggregate demand and aggregate supply graph (with LRAS constant) to illustrate this situation. ii. On your graph, show the adjustment back to long-run equilibrium, and briefly explain the reasons for this adjustment
Step by Step Solution
There are 3 Steps involved in it

Get step-by-step solutions from verified subject matter experts