

Question: Please help with the questions from the image below. 1. The following probability distributions of returns for two stocks have been estimated: Probability Stock X
Please help with the questions from the image below.
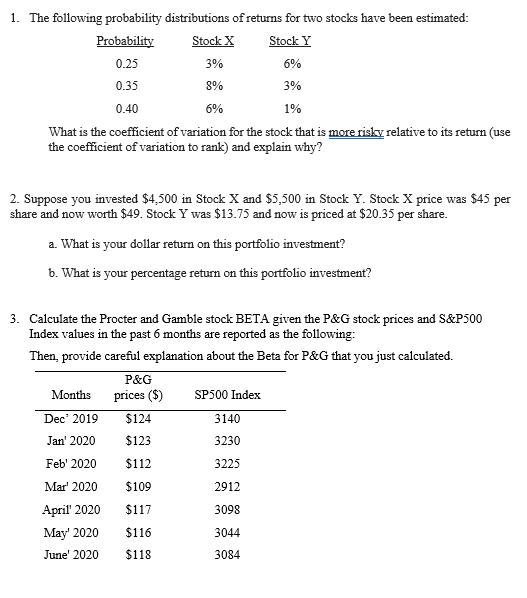
1. The following probability distributions of returns for two stocks have been estimated: Probability Stock X Stock Y 0.25 3% 6% 0.35 8% 39% 0.40 6% 1% What is the coefficient of variation for the stock that is more risky relative to its return (use the coefficient of variation to rank) and explain why? 2. Suppose you invested $4,500 in Stock X and $5,500 in Stock Y. Stock X price was $45 per share and now worth $49. Stock Y was $13.75 and now is priced at $20.35 per share. a. What is your dollar return on this portfolio investment? b. What is your percentage return on this portfolio investment? 3. Calculate the Procter and Gamble stock BETA given the P&G stock prices and S&P500 Index values in the past 6 months are reported as the following: Then, provide careful explanation about the Beta for P&G that you just calculated. P&G Months prices ($) SP500 Index Dec' 2019 $124 3140 Jan' 2020 $123 3230 Feb' 2020 $112 3225 Mar' 2020 $109 2912 April' 2020 $117 3098 May' 2020 $116 3044 June' 2020 $118 3084
Step by Step Solution
There are 3 Steps involved in it

Get step-by-step solutions from verified subject matter experts