

Question: Please help with the ratio analysis portion. Use my other charts with information to fill in the ratio analysis portion. Thank you!!! Below is the
Please help with the ratio analysis portion. Use my other charts with information to fill in the ratio analysis portion. Thank you!!!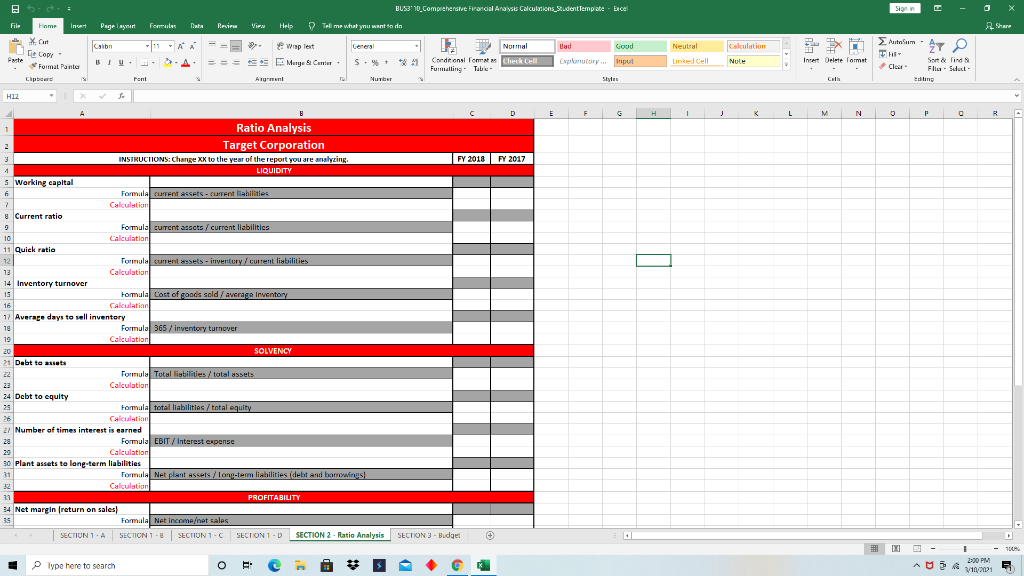
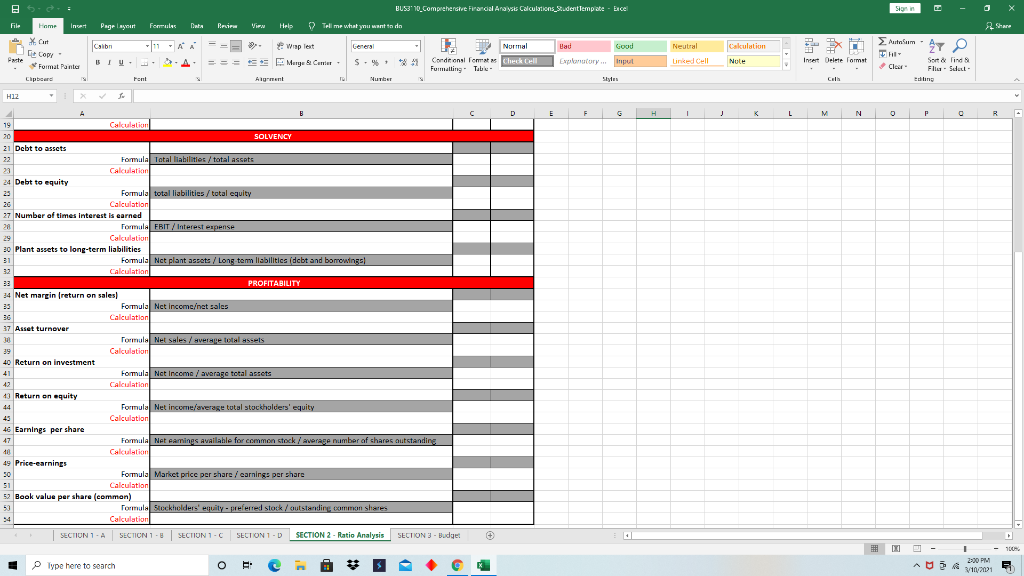
Below is the charts I have all ready completed.
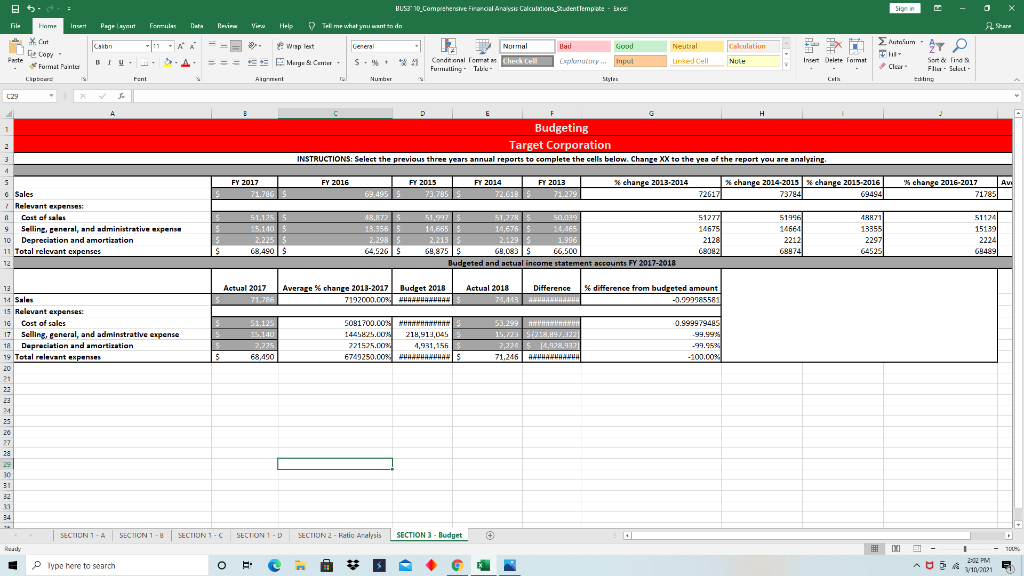
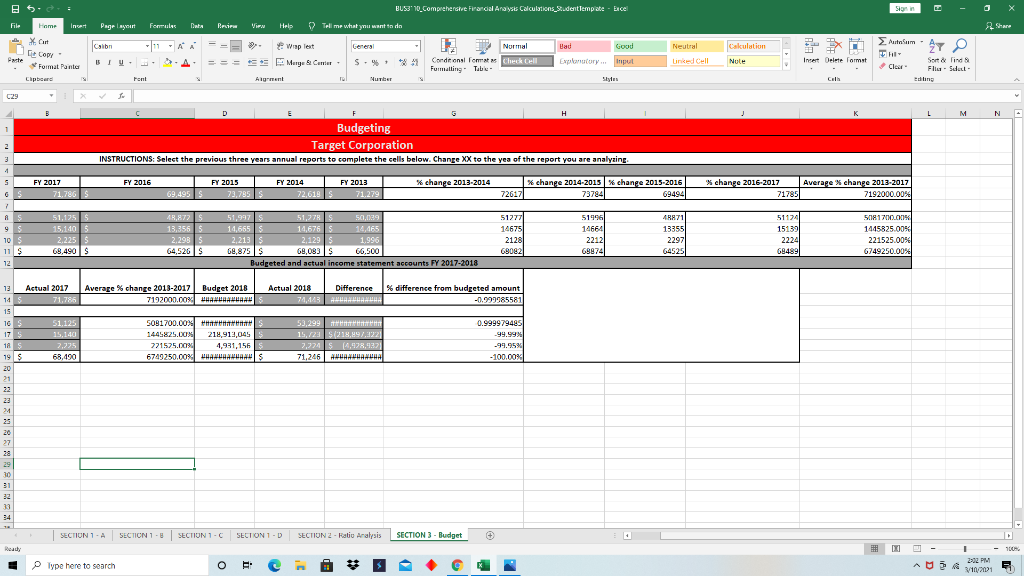
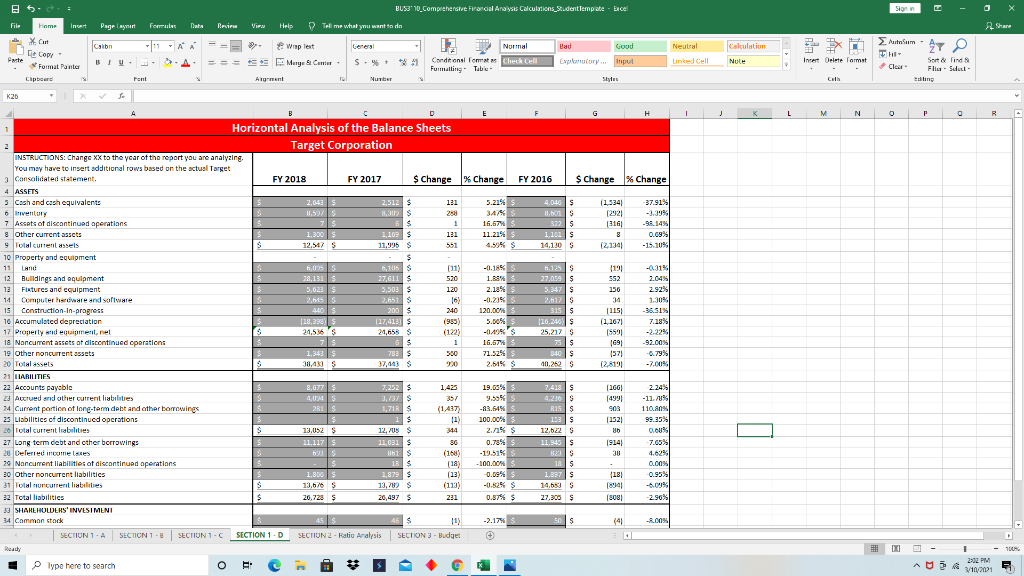
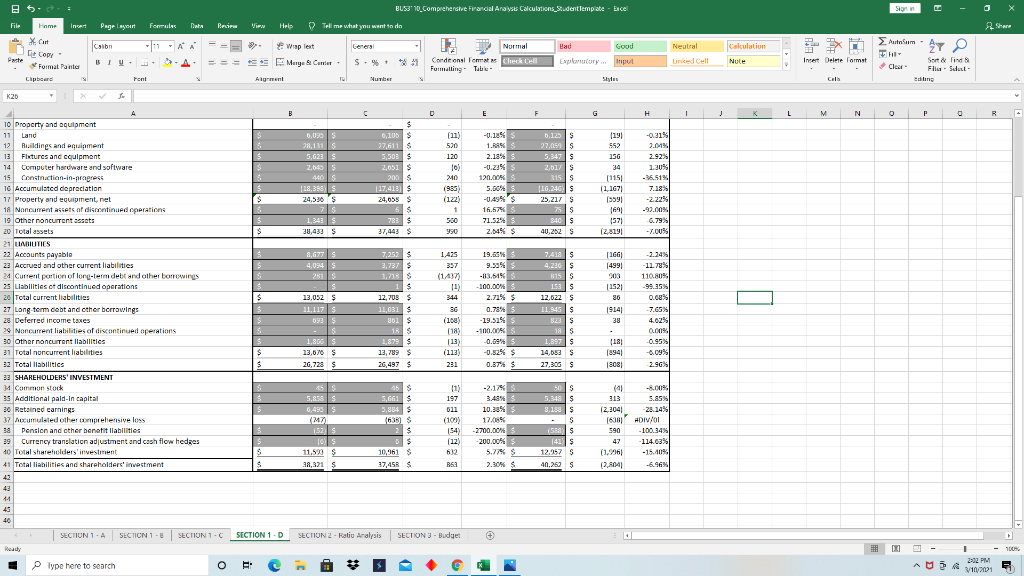
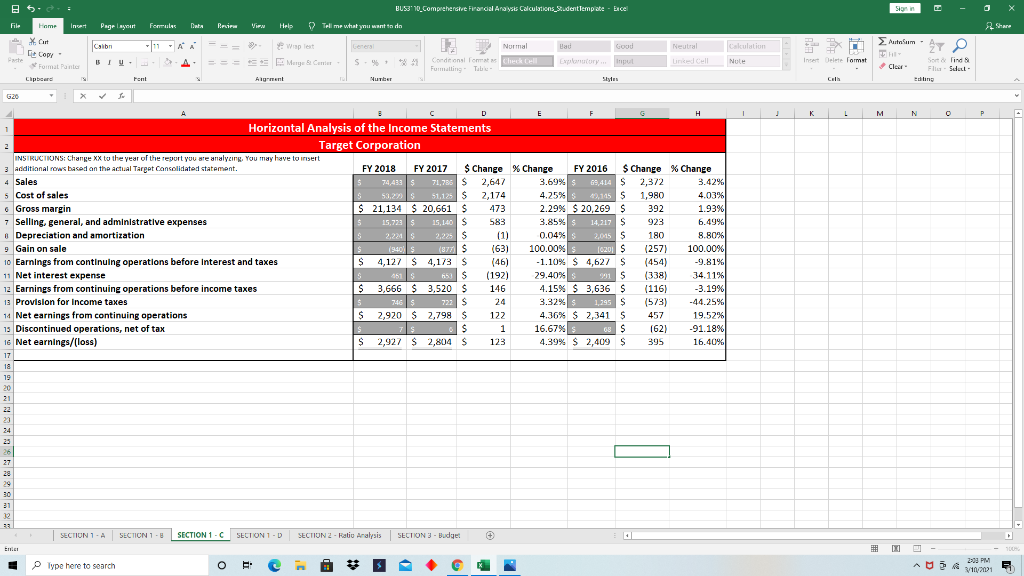
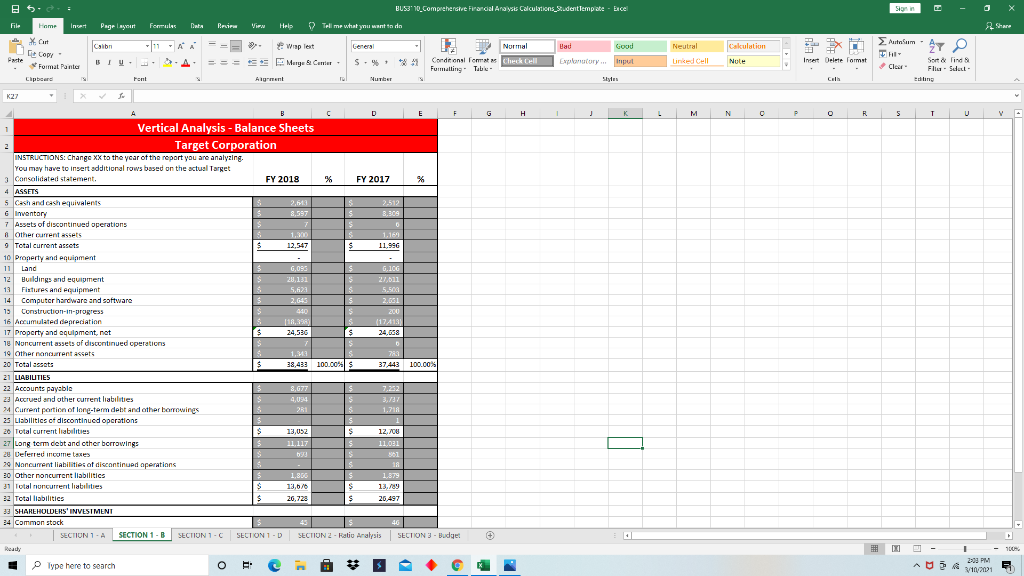
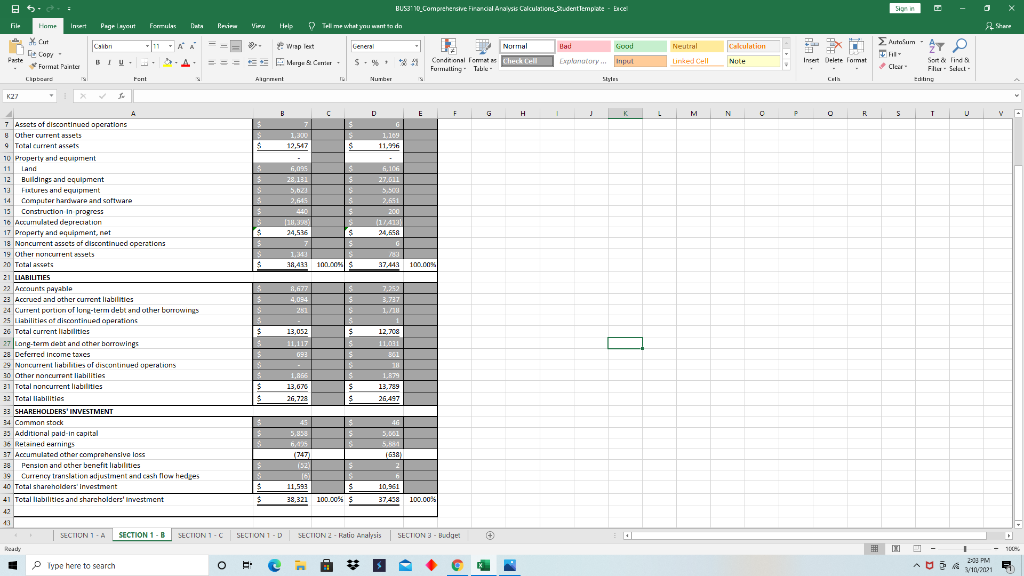
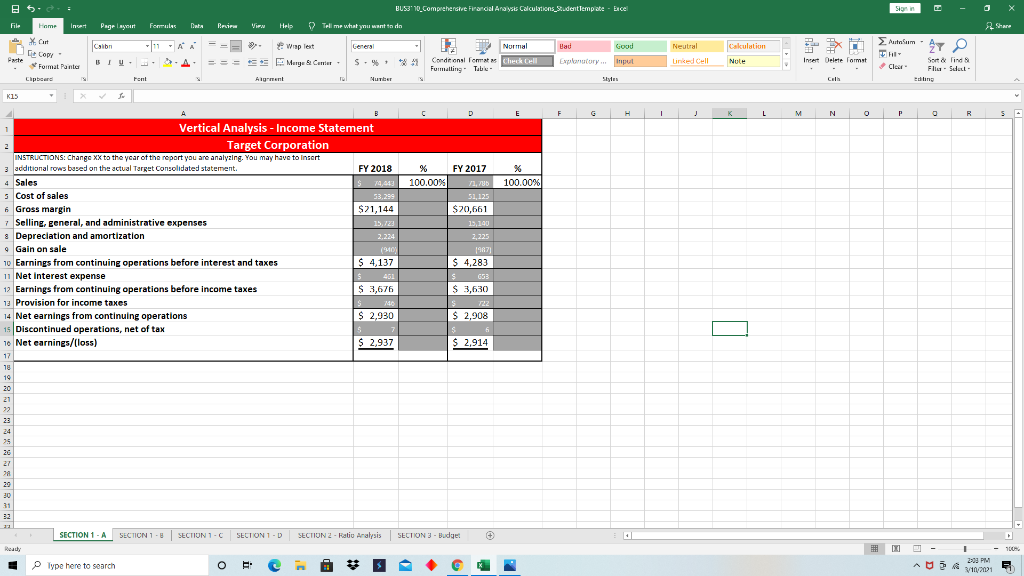
BUS30_Comprehensive Francial Analysts Calculations Student Tempate - Excel - File Home Insert Page Layer Formule Data Beiru Viru Hels Tel me what you want to do A Share Calon AA General Hau Good uitakim Neutral Calculation EX FI 47 O De Copy Format Pantur Wrap lest = = = = Morge Care BIU S. Normal Cordional Format Cheek Cell Furmatling Table Nul Exploratory... input Insert Delete Format Sorto Tind Fliu - Sdel Editing Clipboard Fent Algement Number Slytus Call H12 Bu F G H L M N P R 1 FY 2018 FY 2017 Ratio Analysis 2 Target Corporation 3 3 INSTRUCTIONS:Change XX to the year of the report you are analyzing 4 LIQUIDITY s Working capital Formula current assets. Current liabilities 7 Calculation & Current ratio Formula current assets/ current liabilities 10 Calculation 11 Quick ratio 12 Formula current sets - inventory/current liabilities 13 Calculation 14 Inventory turnover 15 Formula Cost of goods sold / average Inventory 16 Calculation 17 Average days to sell inventory 18 Formula 365 / inventory turnover 19 Calculation SOLVENCY 21 Debt to assets Formula Total liabilities / total assets Calculation 24 Debt to equity Formula total liabilities/total equity Calculation 27 Number of times interest is earned Formula EBIT/ Interest expense Calculation 30 plant assets to long-term liabilities 31 FormulaNet plant assets / long-term liabilities (debt and bamwines 32 Calculation 33 PROFITABILITY 34 Net margin return on sales 35 Fomula Net incomeet sales SECTION 1-A SECTION 1 - SECTION 1-C SECTION 1-D SECTION 2 - Ratio Analysis SECTION 3 - Budget 100% Type here to search AMBA 2:00 PM \/10/2021 BUS30_Comprehensive Francial Analysts Calculations Student Tempate - Excel - File Home Insert Page your Formule Data Beiru Viru Hels Tel me what you want to do A Share Calib AA = = = Wisp lest General Hau Good uitakim Neutral Cakulation EX FI 47 O I- - == Murges Cunier S. Normal Conditional Forma Check Cell Formatting Table Exploratory... input De Copy Format Painter Chipboard Nul Insert Delete Format Sorto lind Flu Sul Edling Font Algement Number Call H12 > D F G 1 K L M N P R B 19 Cakulation 20 SOLVENCY 21 Debt to assets Fomula Total liabilities / total assets 23 Calculation 24 Debt to equity Formula total liabilities/total equity Calculation 27 Number of times interest is earned Formula FRIT / Interest expense Calculation 30 Plant assets to long-term liabilities 31 Formula Nct plant assets / Long term liabilities (debt and borrowings Calculation 33 PROFITABILITY 34 Net margin return on sales 35 Formula Net Incomeet sales Calculation 37 Asset turnover Formula Net sales / uverte tot 39 Calculation 40 Return on investment 41 Formula Net Income / average total assets 42 Calculation 13 Return on equity Formula Net income/average total stockholders' equity Calculation 46 Earnings per share 47 Formula Net camins Available for common stock/ average number of shares outstanding 48 Calculation 49 Price-earnings Formula Market price per share / carning: per share 51 Calculation 52 Book value per share (common) 5) Formula Stockholders' equily preferred stock/ outstanding common shares Calculation SECTION 1-A SECTION 1 - SECTION 1-C SECTION 1-D SECTION 2 - Ratio Analysis SECTION 3 - Budget 100% Type here to search O AUSA 2001 2:00 PM - o BUS3' 10_Comprehensive Financial Analysis Calculations_Student Tempate - Excel Tell me what ynu want in de File Home Insert Page Layer Formule Data Beiru Viru Hels A Share AA Calib General Hau Autum - Good Cakulation Neutral EX FI 47 O = = = Wrap lest = = = = Morge & Cuner + De Copy ute Format Painter Cupboard BIU S.% Normal Conditional Forma Check Cell Furmatling Table Nul Exploratory... put Insert Delete Format Sorto lind Fliu - Sdel Editing Font Algen Number Styles Call 1 Budgeting Target Corporation INSTRUCTIONS: Select the previous three years annual reports to complete the cells below. Change XX to the yea of the report you are analyzing. FY 2016 * change 2013-2014 FY 2017 71.786s FY 2015 73,785 FY 2014 72.618 FY 2013 71.279 * change 2014-2015 change 2015-2016 737841 69494 'S change 2016-2017 Av 717851 69,4955 72617 2 3 3 4 S 6 Sales Relevant expenses A Cost of sales 9 Selling, general, and administrative expense 10 Depreciation and amortization 11 Total relevant expenses 12 51.125 15.110 $ 2.225$ (9.490S 48,8725 13,3565 2.2985 64,526S 51,997 51.27 50,029 14,665 14,67614,465 2,213 2,129 1.996 68,875$ 69,083 S 66.500 Budgeted and actual income statement accounts FY 2017-2018 51277 14675 2128 68082 51996 146641 2212 68974 4R871 13355 2297 64525 511241 15139 2224 69489 $ $ 13 Actual 2017 71,786 Average % change 2013-2017 Budget 2018 7192000.00 LUARLAMUA Actual 2018 Difference 74,443 ALHAMUHAMA % difference from budgeted amount | -0.999985581 IS 51.125 15,140 2.995 14 Sales 15 Relevant expenses 16 Cost of sales Selling, general, and adminstrative expense 18 Depreciation and amortization 19 Total relevant expenses 20 21 22 22 24 5081700.COX HAS 1445825.00 214,913,045 771525.00% 4,931,155 6749250.00 WANAMUHANS 53,299 15,123 S1218,49/322 7,774 $ 14,978,932 71,245 AWUHANUHAMA 0.999979495 -99.99% -99.95% - 100.00% S $ 2.275 68.490 25 27 28 30 31 33 34 SECTION 1-A SECTION 1 - SECTION 1-C SECTION 1-D SECTION 2 - Ratio Analysis SECTION 3 - Budget + Ready 100% Type here to search 12 AUSA 2:02 PM \/10/2021 - BUS3' 10_Comprehensive Financial Analysis Calculations_Student Template - Excel Tel me what you want to do File Home Insert Page Layer Formule Data Beiru WIEN Hels A Share AA = = = Wrap lest uitakim General Hau Good Neutral Cakulation 47 O Calib BIU = S. St Mary Center Normal Cordeonal Formats Check Cell Furmatling Table De Copy Format Painter Cupboard Nul Exploratory... input Insert Delete Format Sort lind Fliu - det Editing Font Alignment Number Ses Call B D M N 1 H Budgeting Target Corporation INSTRUCTIONS: Select the previous three years annual reports to complete the cells below. Change XX to the yea of the report you are analyzing. 2 3 3 4 4 s FY 2016 % change 2013-2014 FY 2017 71,786 FY 2015 33.785 FY 2014 72,618 FY 2013 71.279 % change 2014-2015 % change 2015-2016 73784 69494 % change 2016-2017 71785 Average change 2013-2017 7192000.00% 6 69,4955 72617 1 A 9 10 S 11 S 12 51,1255 15.1405 2.225$ 69.490 S 40,872 13,356S 2,2983 64,526 $ 51,997 51,27S 50,029 14.665S 14,676 14,165 2,213 2,129 1.996 62,875$ 68,033$ 66.500 Budgeted and actual income statement accounts FY 2017-2018 51277 14675 2128 69082 519961 146641 2212 69874 48471 13355 2297 64525 511741 15139 2224 684891 5081700.00% 1445825.00% 221525.00% 6749250.00% Average % change 2013-2017 Budget 2018 7192000.00 LAMU ALLAHU Actual 2018 Difference % difference from budgeted amount 74,443 AHLAWAN SA -0.999985581 13 Actual 2017 14 71,786 15 16 S 51.125 17 15,140 18 2,735 19 $ 68,490 20 21 22 5091700.00% HAS 1445825.00% 218,912,045 771525.00% 4,931,156 6749250.00% WHAN HAVAS 53,299 15,123 $(218,49/322 7,724 S (4,978,937 71,245 AWARDHANWHA 0.999979489 -99.99% -99.95% -100.00% 24 25 27 28 30 31 33 34 SECTION 1-A SECTION 1 - SECTION 1-C SECTION 1-D SECTION 2 - Ratio Analysis SECTION 3 - Budget + Ready 100% Type here to search E- 11 2:02 PM AUSA \/10/2021 - BUS3' 10_Comprehensive Financial Analysis Calculations_Student Tempate - Excel Tel me what you want to do File Home Insert Page Layer Formule Data Beier Viru Hels A Share Calib 11AA General Hau Good uitakim Neutral Cakulation EX FI 47 O Wrap lest = = = = Morge Care S.% A Normal Cordional Format Cheek Cell Fumaling Table Exploratory... input Line Call De Copy Format Painter Cupboard Nul Inter Delete Tormet Sorto Tind Fliu - Sdel Edling Font Algen Number Call K20 F G H L M N R 1 Horizontal Analysis of the Balance Sheets Target Corporation 2 INSTRUCTIONS: Change XX to the year of the report you are analyzing, You may have to insert additional rows based on the actual Target 3 Consolidated statement. FY 2018 FY 2017 $ Change % Change FY 2016 $ Change % Change 4 ASSETS 5 Cash and cash equivalents 2.643 2,643 $ 2,512 $ 121 5.21% 4.040 $ (1.334 37.91% % 6 ventory 0,50$ 3,300 $ 34 3.bos (2921 -3.39% 7 Assets of discontinued operations 7 $ 6 $ 1 3225 -98.14% & Other current assets 1,300 1,109 $ 121 11.215 1.101 $ 8 0.69% 9 Total currenlassels 12,547 S 11.995 $ 551 4.98 S 14.130$ S (2,1341 -15.10% 10 Property and equipment $ 11 Land 6,35 6,105 S (11) -0.18% 6,125S (191 -0.31% 12 Buildings and equipment S agaman 28,131 27,611 S 520 1.68% 27,054s SS2 2.04% 13 Fixtures and equipment $ 5,021 5,503 $ 120 2.18% 5,347 S 150 2.92% 14 Computer hardware and software 2,515S 2,651 s 16) -0.23% 2,617 S 31 1.30% 15 Construction-In-progress 440s 200 $ 240 120.00% 315$ (1151 -36.51% 10 Accumulated depreciation 128,390 LS 127,413 (955) 5.50% 110.240 (1.2071 7.18% 17 Property and equipment, nel S 21,56S 24,653 S (122) -40% 25.217 S (5591 -2.22% 18 Noncurrent assets at discontinued operations $ 16.67% 35 $ 1691 -92.00% 19 other noncurrent assets 1.363 783 $ 71.52% 540 $ (571 -0.79% 20 Total assets 38,439 $ 37,113 S 90 2.61% $ 10.252 S (2,8191 -7.00% 21 LLARILITIES 22 Accounts payable $ 8.677 7,252 $ 1.425 19.00% 7,415$ (166 2.24% 29 Aurued and other current liabilities 4,094 9.50% 4,2309 (4991 -11.70% 24 Current portion of long-term debt and other borrowings 2R1S 1,71R $ (1.437) -83.54% % RISS 903 110.80% 25 Liabilitics of discontinued operations $ 1$ 11) 100.00 153 $ (152) 99.35% 20 Total current liabilities $ 13,0525 12, US $ 344 2.72% $ 12,6225 Ub 0.6% 27 Long term debt and other borrowings $ 11.117 11,031 $ 0.78% 11.945$ 19141 7.65% 20 Deferred income US 361 (168) BES 28 4.62% 20 Noncurrent liabilities of discontinued operations $ $ 18 $ (18) -100.00 18$ 0.00% 30 Other noncurrent liabilities $ 1.850 S 1,879 $ (13) 0.69% $ 1.897 (18) 0.95% 31 Total moncurrent liabilities S 13,676 S 13,7025 (113) -0.52% $ 14,653 S [8941 -6.09 32 Total liabilities $ 26,728 $ 26,497 $ 221 0.57% $ 27,300 $ 1808 -2.90% 33 SHAREHOLDERS' INVESTMENT 34 Common stock $ 11) -2.17 50 $ $ (41 -2.00% SECTION 1-A SECTION 1 SECTION 1-C SECTION 1-D SECTION 2 - Ratio Analysis SECTION 3. Budget 100% 2:02 PM Type here to search O AMA 2011 - X BUS3' 10_Comprehensive Financial Analysis Calculations_Student Tempate - Excel Tel me what you want to do File Home Insert Page your Formule Data Beiru Viru Hels A Share Calon 11AA = = = General Hau utnam Good Neutral Calculation EX FI 47 O Wrap lest Murges Cunier - = = = BIU S. UM De Copy Format Panto Cupboard Normal Cordional Format Cheek Cell Furmatling Table Exploratory...pl Linked Call Nul Inter Delete Tormet Sorto lind Fliu - det Editing Font Algement Call H 1 L M N P R 0,050 21,131 5.623 $ 2,045 410 118,398 24,530$ $ 0,105 $ 97,611 $ 5,503 $ 2,051 $ 200S 117,413) $ 24,655 $ $ 783 $ 27,4435 (11) 1 520 120 10) 20 (985) (122) 1 -0.185 1. 2.18% -0.2% 120.00% 5.60% -0.49% 16.67% 71.52% 2,64% $ 0.125S $ 27.054 S 5,347 2.61/s /S 315S 116.240S 25,217 S $ 840 $ 40,202 $ (191 552 15G 34 (1151 (1,1671 (5591 169 1571 12,8191 -0.31% 7.14% 2.92% 1.30% -36.51% 7.18% -2.25 -92.00% -6.79% -7.00% $ S 1,343 39,4385 $ 950 $ 8,677 4,0949 281 S (1661 (4991 4 10 Property and equipment 11 Land 12 Buildings and equipment 13 Fixtures and coulpment 74 Computer hardware and software 15 Constnactian-in-progress 16 Accumulated depreciation 17 Property and equipment, net 18 Noncurrent assets of disontinued operations 19 Other noncurrent assets 20 Total assets 21 LIABILITIES 22 Accounts payable 23 Accrued and other current liabilities 24 Current portion of long-term debt and other borrowings 25 Liabilities of discontinued operations 20 Total current liabilities 27 Long-term debt and other borrowings 28 Deferred income taxes 39 Noncurrent liabilities of discontinued operations 30 Other noncurrent liabilities 31 Total noncurrent liabilities 32 Total liabilities 33 SHAREHOLDERS' INVESTMENT 34 Common stock ss Additional paid in capital 30 Retained earnings 37 Accumulated other comprehensive loss 38 Pension and other benatit liabilities 29 Currency translation adjustment and cash flow hedges 40 Total shareholders investment 41 Total liabilities and shareholders investment 42 1,435 337 (1437) 11 ) 344 $ $ 7,252 3,737 $ 1,715 $ 1 $ 12,703 $ 11,031 $ 801 $ 18 S 1,879 $ $ 13,789 $ 26,497 $ 19.65 9.59% -83.61% -100.00% 2.715 $ 0.78% -19.515 -100.00% -0.69% -0.625 $ 13,052 $ 11,117$ 0929 5 1.800S 13,070 S 2G, 720 $ (1521 86 19141 38 . 7.418 S 4.230 815S 153 $ 12.022 11.945$ 3239 18S 1.897 $ 14,0385 27,300 $ -11.78% 110.80% -99.35% 0.08% -7.65% 4.02% 0.00% 0.95% 36 (100) (18) (13) (113) 231 1181 (894) $ $ 0.37% $ 18081 2.96% 45S 5.RS 11) 197 611 (100) (27) 152 OS 11.520 $ 38,321 $ 45 $ 5,661 $ 5,894 $ (635) S $ $ 10,961 $ 37,450 $ $ -2.17% 3.48% 10.385 $ 17.85 -2700.00% 200.00% 5.77% $ 2.30% $ 50 S 5.348$ 8.1589 S (5889 $ 141 S 12.957 S 40.250 S (91 313 (2,3041 [6381 590 47 (1,996 (7.2011 -8.00% 5.85% -25.14% #DIV/01 100.34% 114.03% -15.40% -6.96% ( (12) $ $ R53 45 40 SECTION 1-A SECTION 1 - SECTION 1-C SECTION 1-D SECTION 2 - Ratio Analysis SECTION 3 - Budget Ready 100% 1 2:02 PM \/10/2021 Type here to search O 12 AMA BUS3' 10_Comprehensive Financial Analysis Calculations_Student Template - Excel - File Home Insert Page layout Formule Data Beiru Viru Hels Tel me what you want to do A Share X. Cart De Copy Autosum- Calon 11AA Hall Good Neutral XF Torkulation --- 9 Wipes = = = 5 E Murger Carrier 27 A S - % Normal Cordons Check Cell Fumaling To Exploratory.pl Nule Insert Delete Format Clour Sorto find & Flu - Sul Editing Cupboard Font Alignment Number Styles Call H . N 0 P 1 D E Horizontal Analysis of the Income Statements 2 Target Corporation INSTRUCTIONS: Change Xx to the year of the report you are analyzing. You may have to insert 3 Additional rows based on the actual Target Consolidated statement. FY 2018 FY 2017 $ Change % Change FY 2016 $ Change % Change 4 Sales $ 74,433 71,785 $ 2,647 3.69% $ 69,414 $ 2,372 3.42% 5 Cost of sales $ 53,20 51,125 $ 2,174 4.25% S 409,115 S 1,980 4.03% Gross margin $ 21,134 $ 20,661 $ 473 2.29% $ 20,269 $ 392 1.93% 7 Selling, general, and administrative expenses 5 15,723 15,140 S 583 3.85%$ 14,217 S 923 6.49% % Depreciation and amortization 2.224S (1) 0.04% 180 8.80% 9 Gain on sale $ 1940s (63) 100.00% 10201 S (257) 100.00% 10 Earnings from continuing operations before Interest and taxes $ 4,127 $ 4,173 $ (46) -1.10% $ 4,627 S (454) -9.81% 11 Net interest expense 451 650 $ (192) 29.40% S 991 S (338) 34.11% 12 Earnings from continuing operations before income taxes $ 3,666 $ 3,520 $ 146 4.15% $ 3,636 $ (116) -3.19% 13 Provision for Income taxes $ 246 746 $ 729 $ 24 3.32% 1,245 S (573) -44.25% 14 Net earnings from continuing operations $ $ 2,920 $ 2,798 $ 122 4.36% $ 2,341 S 457 19.52% 13 Discontinued operations, net of tax $ $ 1 16.67% $ 68 S 162) -91.18% 16 Net earnings/(loss) $ 2,927 $ 2,804 S 123 4.39% $ 2,409 $ 395 16.40% 2,095 s 2.22 $ (877$ 17 18 19 20 21 23 24 25 27 29 29 30 31 32 SECTION 1-A SECTION 1-8 SECTION 1-C SECTION 1-D SECTION 2 - Ratiu Analysis SECTION 3 - Budget En. Type here to search O 12 AMBA 2:09 PM V10/ 01 BUS30_Comprehensive Francial Analysts Calculations Student Tempate - Excel span - File Home Insert Page Layer Formule Data Beiru Viru Hele Tel me what you want to do A Share Calib AA General Hau Good Neutral Calculation uitakim EX FI 47 O Wrap lest Murges Cunier 2 Normal Cordional Forma Check Cell Formatting Table === S.% Explomtory... input De Copy Format Panta Cupboard Nul Inter Delete Tormet Sorto Tind Flu Sul Font Algement Number Call K27 G H J . M M N O R 5 T E F 1 Vertical Analysis - Balance Sheets 2 Target Corporation INSTRUCTIONS: Change XX to the year of the report you are analyzing, You may have to insert additional rows based on the actual Target 3 Consolidated statement. FY 2018 % FY 2017 % 4 ASSETS 5 Cash and chequivalents 2,51 2.512 Inventory 8,597 8,309 7 Assets of discontinued operations $ $ A other current assets 1,300 1.164 9 Total current assets $ 12,5347 $ 11.96 10 Property and equipment 11 Land $ 6,095 s 6.10G 12 Buildings and equipment S 20131 IS 27,621 13 Fixtures and equipment 5,12:1 S 5.504 14 Computer hardware and software $ 2.643 $ 2.001 73 Construction in progress S 440 S 200 16 Accumulated depreciation $ (17419) 17 Property and equipment, net $ $ 24.658 18 Noncurrent assets of discontinued operations $ 0 19 Other naartent assets S 20 Total assets 38,433 100.00 $ 37.443 100.00% 21 LIABILITIES 22 Accounts payable 8,677 $ 7,252 za Accrued and other current liabilities 4,094 $ 3.737 Current portion of long-term debt and other borrowings 201 S 1.718 23 Liabilities of discontinued operations $ $ 20 Total current liabilities $ 13,052 S 12,700 27 Long term debt and other borrowings $ 11.117 s 11,031 28 Deferred income taxes 361 20 Noncurrent liabilities of discontinued operations 30 Other noncurrent liabilities $ $ 1.379 31 Total nuncurrent liabilities $ 13,6/6 $ 13./89 22 Total liabilities $ 26,728 $ 26.497 23 SHAREHOLDERS' INVESTMENT 34 Common stock SECTION 1 - A SECTION 1-B SECTION 1-C SECTION 1-D SECTION 2 - Ratio Analysis SECTION 3 - Budget Ready 1.800 100% Type here to search 3 AMA 2011 2:09 PM V10/ - File Home Insert Page Layer Formule Data Beiru A Share - Calon BUS3' 10_Comprehensive Financial Analysis Calculations_Student Tempate - Excel Viru Hels Tel me what you want to do Wrap lest General 2 Normal Hau Good St Mary Center S. Conditional Forma Check Cell Exploratory... put Furmaling. Ta Algement Number = = = Autum - Neutral EX FI Calculation 47 O == Nul De Copy ate Format Panto Clipboard Inter Delete Tormet Sort lind Fliu - Sdel Editing Font Call K27 D E F G H J K . M N C R 5 T U 1.109 1.30 12,517 S $ 11.996 $ 6,095 28,13 5,62 2,645 s IS IS $ IS s $ 6.106 27,621 5.500 2.651 200 S $ S S $ 24,536 24,658 1 18,41 183 37443 s 100.00MS 100.00% $ A 7 Acasts of discontinued operations Other current assets 9 Total current Assets 10 Property and equipment 11 Land 12 Buildings and equipment 13 Hatures and equipment 14 Computer hardware and saftware 15 Construction in progress 16 Autumusted deprecation 17 Property and equipment, net 18 Noncurrent assets of discontinued operations 19 Other noncurrentes 20 Total acts 21 LIABILITIES 22 Accounts payable 23 Accrued and other current liabilities 24 Current portion of long-term debt and other borrowings 25 Liabilities of discontinued operations 26 Total current liabilities 27 Long-term debt and other borrawings 28 Deferred income taxes 29 Noncurrent liabilities of discontinued operations 30 Other noncurrent liabilities 31 Total noncurrent liabilities 32 Total liabilities 33 SHAREHOLDERS' INVESTMENT 34 Common stock 35 Additional paid in capital 36 Retained earnings 37 Accumulated other comprehensive loss 28 Pension and other benefit liabilities 14 Currency translation adjustment and cash flow hedges 40 Total shareholders investment 41 Total liabilities and shareholders investment 42 4,094 287 3,737 1 1 $ s s S $ $ $ 13,052 11,117 092 12.708 11.091 SG1 II S S S $ $ 1,AGE 13,670 26,728 $ $ 1.679 13,789 26.497 $ S 5,850 46 5.661 5.541 (638) $ (747 152 $ S 11,593 $ 38,321 100.00% $ $ $ 10.961 37 438 100.00 SECTION 1-A SECTION 1 - B SECTION 1-C SECTION 1-D SECTION 2 - Ratiu Analysis SECTION 3 - Budget Ready 100% Type here to search 1 2:09 PM V10/ 12 3 AMA 2011 - BUS3' 10_Comprehensive Financial Analysis Calculations_Student Tempate - Excel Tel me what you want to do File Home Insert Page your Formule Data Beiru Viru Hels A Share Calib AA General Hau Good uitakim Neutral Cakulation 47 O Wrap lest = = = 5 Mary Cander - S.% Normal Cordional Format Cheek Cell Furmatling Table Exploratory... input De Copy Format Panta Cupboard Nul Insert Delete Format Cle Sorto Tind Flu Sul Edling Fent Alignment Number Shes Call K15 C D E F H 1 L M N p R 5 2 % 100.00% 1 Vertical Analysis - Income Statement Target Corporation INSTRUCTIONS: Change XX to the year of the report you are analyzing. You may have to Insert 3 additional rows based on the actual Target Consolidated statement. FY 2018 % 4 Sales 74,443 100.00% s Cost of sales 33.299 6 Gross margin $21,144 7 Selling. Eeneral, and administrative expenses 15,723 8 Depreciation and amortization 2.224 9 Gain on sale 1910 10 Earnings from continuing operations before interest and taxes $ 4,137 u Net interest expense S 12 Earnings from continuing operations before income taxes $ 3,676 1a Provision for income taxes 14 Net earnings from continuing operations $ 2,930 15 Discontinued operations, net of tax 5 10 Net earnings/(loss) $ 2,937 FY 2017 71,700 51,125 $70,661 15,190 2,225 Mr $ 4,283 $ G53 $ 3,630 $ 722 $ 2,908 $ 6 $ 2,914 17 18 19 20 21 22 23 25 27 7 31 SECTION 1. A SECTION 1 - SECTION 1-C SECTION 1-D SECTION 2 - Ratio Analysis SECTION 3 - Budget Ready 100% Type here to search 12 AMA 2011 2:03 PM V10/
Step by Step Solution
There are 3 Steps involved in it

Get step-by-step solutions from verified subject matter experts