

Question: Please help with the red locations. CALCULATOR PRINTER VERSION BACK NEXT Target Corporation Wal-Mart Stores, Inc. vel Income Statement Data for Year rel vel evel
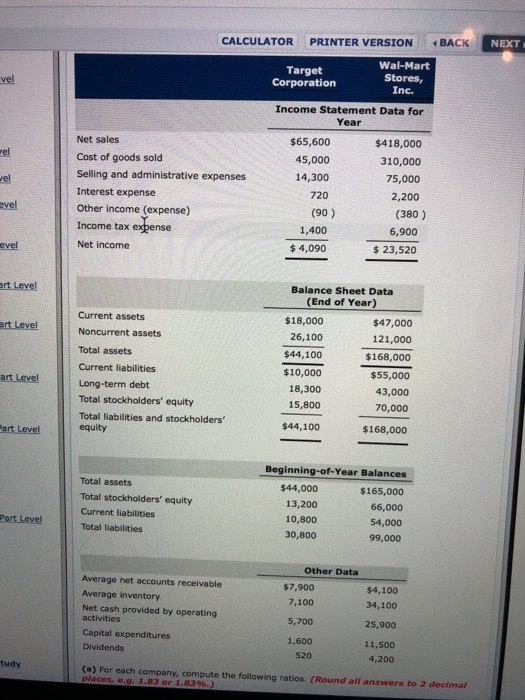
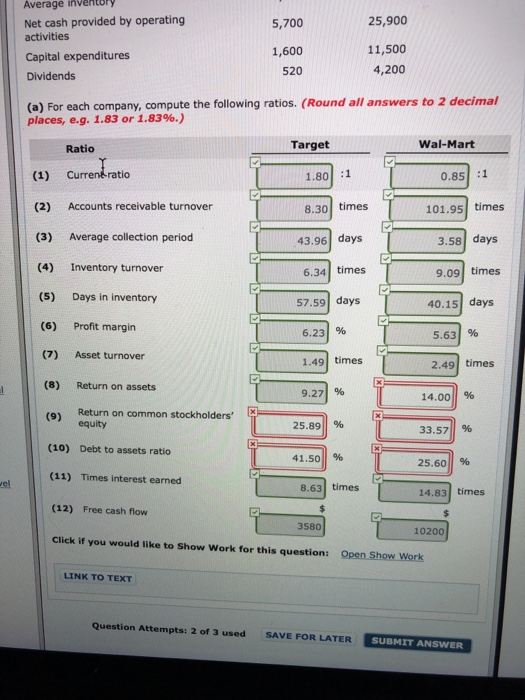
CALCULATOR PRINTER VERSION BACK NEXT Target Corporation Wal-Mart Stores, Inc. vel Income Statement Data for Year rel vel evel Net sales Cost of goods sold Selling and administrative expenses Interest expense Other income (expense) Income tax espense Net income $65,600 45,000 14,300 720 $418,000 310,000 75,000 2,200 (90) (380) 1,400 6,900 4,090 $23,520 evel Balance Sheet Data (End of Year) Current assets Noncurrent assets Total assets Current liabilities Long-term debt Total stockholders' equity Total liabilities and stockholders $18,000 26,100 $44,100 $10,000 18,300 15,800 $44,100 $47,000 121,000 $168,000 $55,000 43,000 70,000 $168,000 art Level equity Total assets Total stockholders' equity Current liabilities Total liabilities Beginning-of-Year Balances $165,000 66,000 54,000 99,000 $44,000 13,200 10,800 30,800 Other Data Average net accounts receivable Average inventory Net cash provided by operating $7,900 7,100 5,700 1,600 520 $4,100 34,100 25,900 11,500 4,200 Capital expenditures Dividends tudy (a) For each company, compute the following ratios. (Round all answers to 2 decimal aces, e.g. 1.83 or 1.83%
Step by Step Solution
There are 3 Steps involved in it

Get step-by-step solutions from verified subject matter experts