

Question: Please help with the steps to solve in excel with the solution/formulas as well thanks Dowload monthly stock price data for Oracle Corporation (orcl), Microsoft
Please help with the steps to solve in excel with the solution/formulas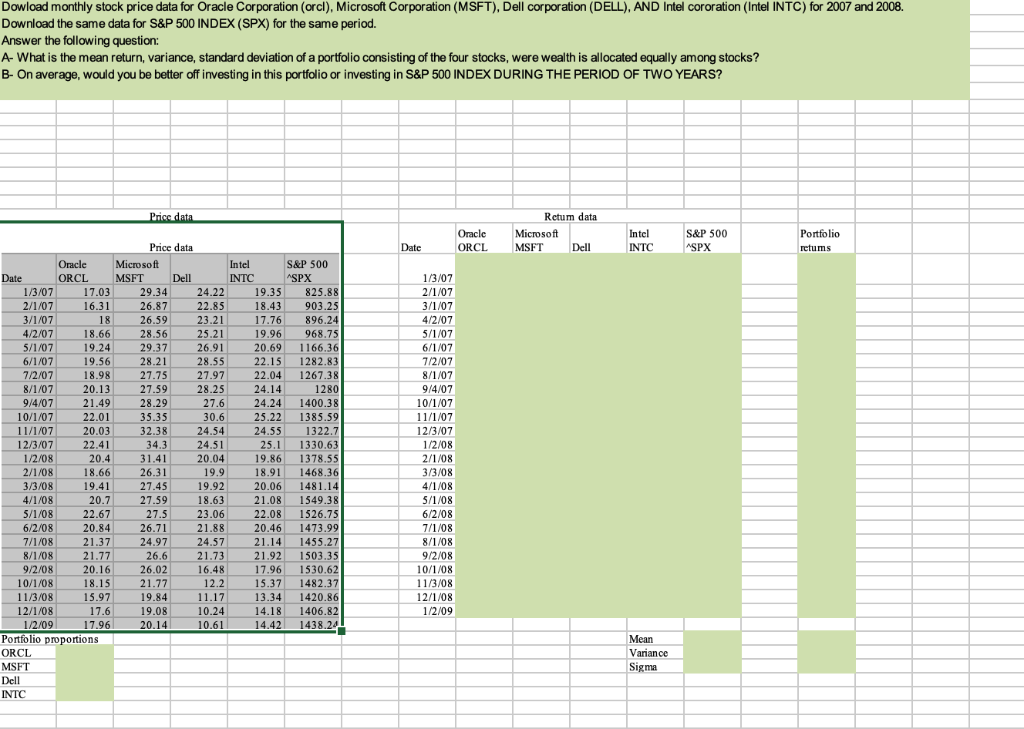 as well thanks
Dowload monthly stock price data for Oracle Corporation (orcl), Microsoft Corporation (MSFT), Dell corporation (DELL), AND Intel cororation (Intel INTC) for 2007 and 2008. Download the same data for S&P 500 INDEx (SPX) for the same period. Answer the following question: A- What is the mean return, variance, standard deviation of a portfolio consisting of the four stocks, were wealth is allocated equally among stocks? B- On average, would you be better off investing in this portfolio or investing in S&P 500 INDEX DURING THE PERIOD OF TWO YEARS? Rctum data Oracle ORCLMSFT Portfolio retums Microsoft S&P 500 SPX Date Dell INTC Oracle ORCL S&P 500 SPX Date MSE934 22 Dell INTC 1/3/07 1/3/07 2/1/07 3/1/07 4/2/07 5/1/07 6/1/07 7/2/07 8/1/07 914/07 10/1/07 1 1/1/07 12/3/07 1/2/08 2/1/08 3/3/08 4/1/08 5/1/08 6/2/08 7/1/08 8/1/08 9/2/08 10/1/08 11/3/08 12/1/08 1/2/09 17.0329.34 24.22 19.35 825.88 18.43 903.25 17.76 896.24 19.96 968.75 20.69 1166.36 22.15 1282.83 22.041267.38 1280 24.24 1400.38 30.6 25.22 1385.59 1322.7 25.1 1330.63 19.86 1378.55 18.91 1468.36 20.06 1481.14 21.08 1549.38 22.08 1526.75 20.46 1473.99 16.31 26.87 26.59 28.56 1/07 4/2/07 5/1/07 7/2/07 8/1/07 9/4/07 10/1/07 11/1/07 12/3/07 1/2/08 2/1/08 3/3/08 4/1/08 28.25 28.29 22.01 20.03 6/2/08 1/08 8/1/08 9/2/08 10/1/08 11/3/08 12/1/08 1/2/09 24.97 24.57 21.14 1455.2 21.92 1503.35 17.96 1530.62 5.37 1482.37 13.34 1420.86 4.18 1406.82 14.42 1438.24 19.84 19.08 Portfolio proportions ORCL MSFT Dell INTC Mean Variance Sigma Dowload monthly stock price data for Oracle Corporation (orcl), Microsoft Corporation (MSFT), Dell corporation (DELL), AND Intel cororation (Intel INTC) for 2007 and 2008. Download the same data for S&P 500 INDEx (SPX) for the same period. Answer the following question: A- What is the mean return, variance, standard deviation of a portfolio consisting of the four stocks, were wealth is allocated equally among stocks? B- On average, would you be better off investing in this portfolio or investing in S&P 500 INDEX DURING THE PERIOD OF TWO YEARS? Rctum data Oracle ORCLMSFT Portfolio retums Microsoft S&P 500 SPX Date Dell INTC Oracle ORCL S&P 500 SPX Date MSE934 22 Dell INTC 1/3/07 1/3/07 2/1/07 3/1/07 4/2/07 5/1/07 6/1/07 7/2/07 8/1/07 914/07 10/1/07 1 1/1/07 12/3/07 1/2/08 2/1/08 3/3/08 4/1/08 5/1/08 6/2/08 7/1/08 8/1/08 9/2/08 10/1/08 11/3/08 12/1/08 1/2/09 17.0329.34 24.22 19.35 825.88 18.43 903.25 17.76 896.24 19.96 968.75 20.69 1166.36 22.15 1282.83 22.041267.38 1280 24.24 1400.38 30.6 25.22 1385.59 1322.7 25.1 1330.63 19.86 1378.55 18.91 1468.36 20.06 1481.14 21.08 1549.38 22.08 1526.75 20.46 1473.99 16.31 26.87 26.59 28.56 1/07 4/2/07 5/1/07 7/2/07 8/1/07 9/4/07 10/1/07 11/1/07 12/3/07 1/2/08 2/1/08 3/3/08 4/1/08 28.25 28.29 22.01 20.03 6/2/08 1/08 8/1/08 9/2/08 10/1/08 11/3/08 12/1/08 1/2/09 24.97 24.57 21.14 1455.2 21.92 1503.35 17.96 1530.62 5.37 1482.37 13.34 1420.86 4.18 1406.82 14.42 1438.24 19.84 19.08 Portfolio proportions ORCL MSFT Dell INTC Mean Variance Sigma
Step by Step Solution
There are 3 Steps involved in it

Get step-by-step solutions from verified subject matter experts