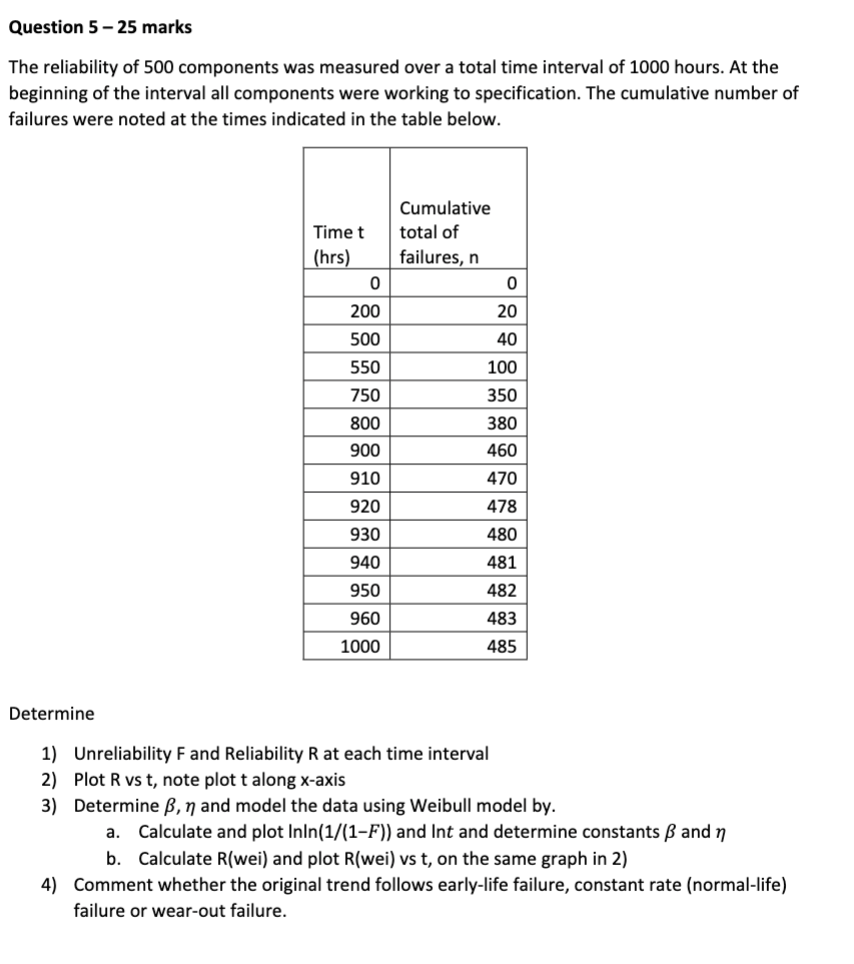
Question: PLEASE HELP WITH THESE QUESTIONS ASAP Question 5-25 marks The reliability of 500 components was measured over a total time interval of 1000 hours. At

PLEASE HELP WITH THESE QUESTIONS ASAP

PLEASE HELP WITH THESE QUESTIONS ASAP Question

Question 5-25 marks The reliability of 500 components was measured over a total time interval of 1000 hours. At the beginning of the interval all components were working to specification. The cumulative number of failures were noted at the times indicated in the table below. Cumulative Time t total of (hrs) failures, n 0 0 200 20 500 40 550 100 750 350 800 380 900 460 910 470 920 478 930 480 940 481 950 482 960 483 1000 485 Determine 1) Unreliability F and Reliability R at each time interval 2) Plot R vs t, note plot t along x-axis 3) Determine B, n and model the data using Weibull model by. a. Calculate and plot Inln(1/(1-F)) and Int and determine constants and n b. Calculate R(wei) and plot R(wei) vs t, on the same graph in 2) 4) Comment whether the original trend follows early-life failure, constant rate (normal-life) failure or wear-out failure

Step by Step Solution

There are 3 Steps involved in it

1 Expert Approved Answer
Step: 1 Unlock blur-text-image
Question Has Been Solved by an Expert!

Get step-by-step solutions from verified subject matter experts

Step: 2 Unlock
Step: 3 Unlock

Students Have Also Explored These Related General Management Questions!