

Question: please help with these questions thanks The following scatter plot indicates: 18. X A. Perfect positive correlation B. Virtually no correlation C. Positive correlation D.
please help with these questions thanks
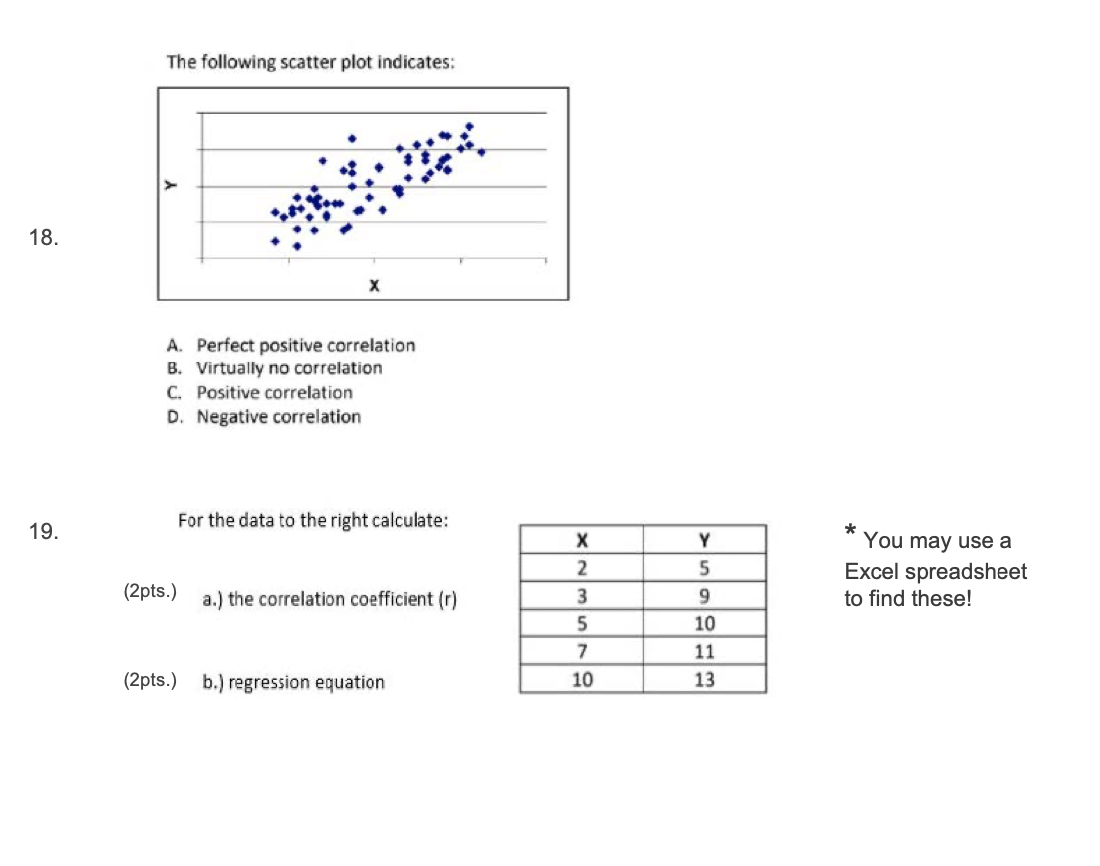
The following scatter plot indicates: 18. X A. Perfect positive correlation B. Virtually no correlation C. Positive correlation D. Negative correlation 19. For the data to the right calculate: X * You may use a Excel spreadsheet (2pts.) a.) the correlation coefficient (r) to find these! VUWN 10 11 (2pts.) b.) regression equation 10 13
Step by Step Solution
There are 3 Steps involved in it
1 Expert Approved Answer
Step: 1 Unlock

Question Has Been Solved by an Expert!
Get step-by-step solutions from verified subject matter experts
Step: 2 Unlock
Step: 3 Unlock