

Question: Please help with this financial model for Zoe's Kitchen Msstructions: Please papulate green shaded cells with a formula. 1PDln2014 2013 Adjusted EBrTDA, $M (Exh bit
Please help with this financial model for Zoe's Kitchen
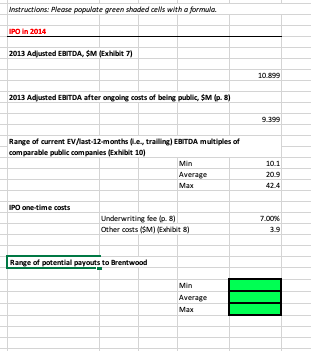
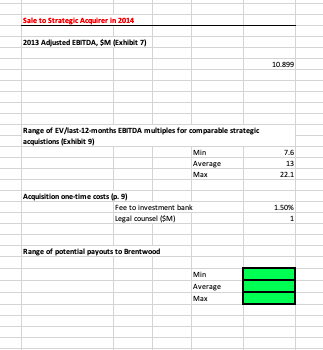
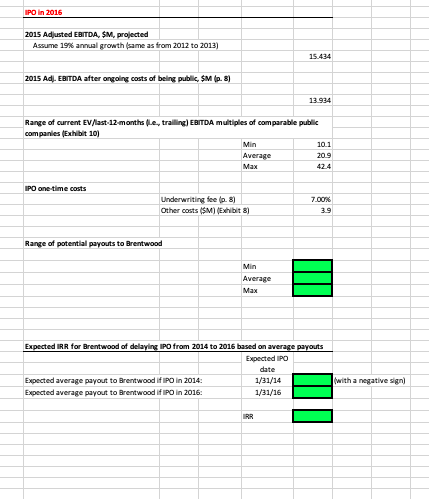
Msstructions: Please papulate green shaded cells with a formula. 1PDln2014 2013 Adjusted EBrTDA, \$M (Exh bit 7) 2013 Adusted EBrrDA after angoing costs of being public, $M(p.8) Range of current EV//ast-12-months (le., tralling] EBITDA multiples of comparable public companles (Exhbit 10) \begin{tabular}{|l|r|} \hline Min & 10.1 \\ \hline Average & 20.9 \\ \hline Max & 42.4 \\ \hline \end{tabular} IPD ane-time costs Range of potentlal payouts to Brentwood \begin{tabular}{|l|l|} \hline Min & \\ \hline Average & \\ \hline Max & \\ \hline \end{tabular} Range of EV/last-12-months EBITDA multiples for comparable strategic acqulstions (Exhibit 9) Min Average Max Acqulsition ane time costs (p. 9) IPD ln2015 2015 Adlusted EBITDA, $M,prolected Assume 19\% annul growth (same as from 2012 to 2013) 2015 Adj. EBITDA after angoling costs of beling public, $M(2.8) Range of current EV/last-12-months (Le. tralling) EBITDA multiples of comparable public companles ( Exhibit 10) IPD ane-time costs Range of potentlal payouts to Brentwood Expected IRR for Brentwood of delaylng IPD from 2014 to 2015 based on average payouts Msstructions: Please papulate green shaded cells with a formula. 1PDln2014 2013 Adjusted EBrTDA, \$M (Exh bit 7) 2013 Adusted EBrrDA after angoing costs of being public, $M(p.8) Range of current EV//ast-12-months (le., tralling] EBITDA multiples of comparable public companles (Exhbit 10) \begin{tabular}{|l|r|} \hline Min & 10.1 \\ \hline Average & 20.9 \\ \hline Max & 42.4 \\ \hline \end{tabular} IPD ane-time costs Range of potentlal payouts to Brentwood \begin{tabular}{|l|l|} \hline Min & \\ \hline Average & \\ \hline Max & \\ \hline \end{tabular} Range of EV/last-12-months EBITDA multiples for comparable strategic acqulstions (Exhibit 9) Min Average Max Acqulsition ane time costs (p. 9) IPD ln2015 2015 Adlusted EBITDA, $M,prolected Assume 19\% annul growth (same as from 2012 to 2013) 2015 Adj. EBITDA after angoling costs of beling public, $M(2.8) Range of current EV/last-12-months (Le. tralling) EBITDA multiples of comparable public companles ( Exhibit 10) IPD ane-time costs Range of potentlal payouts to Brentwood Expected IRR for Brentwood of delaylng IPD from 2014 to 2015 based on average payouts
Step by Step Solution
There are 3 Steps involved in it

Get step-by-step solutions from verified subject matter experts