

Question: Please help with this macro problem The graph below depicts the aggregate expenditure line. This graph depicts the aggregate expenditure line before a substantial increase
Please help with this macro problem
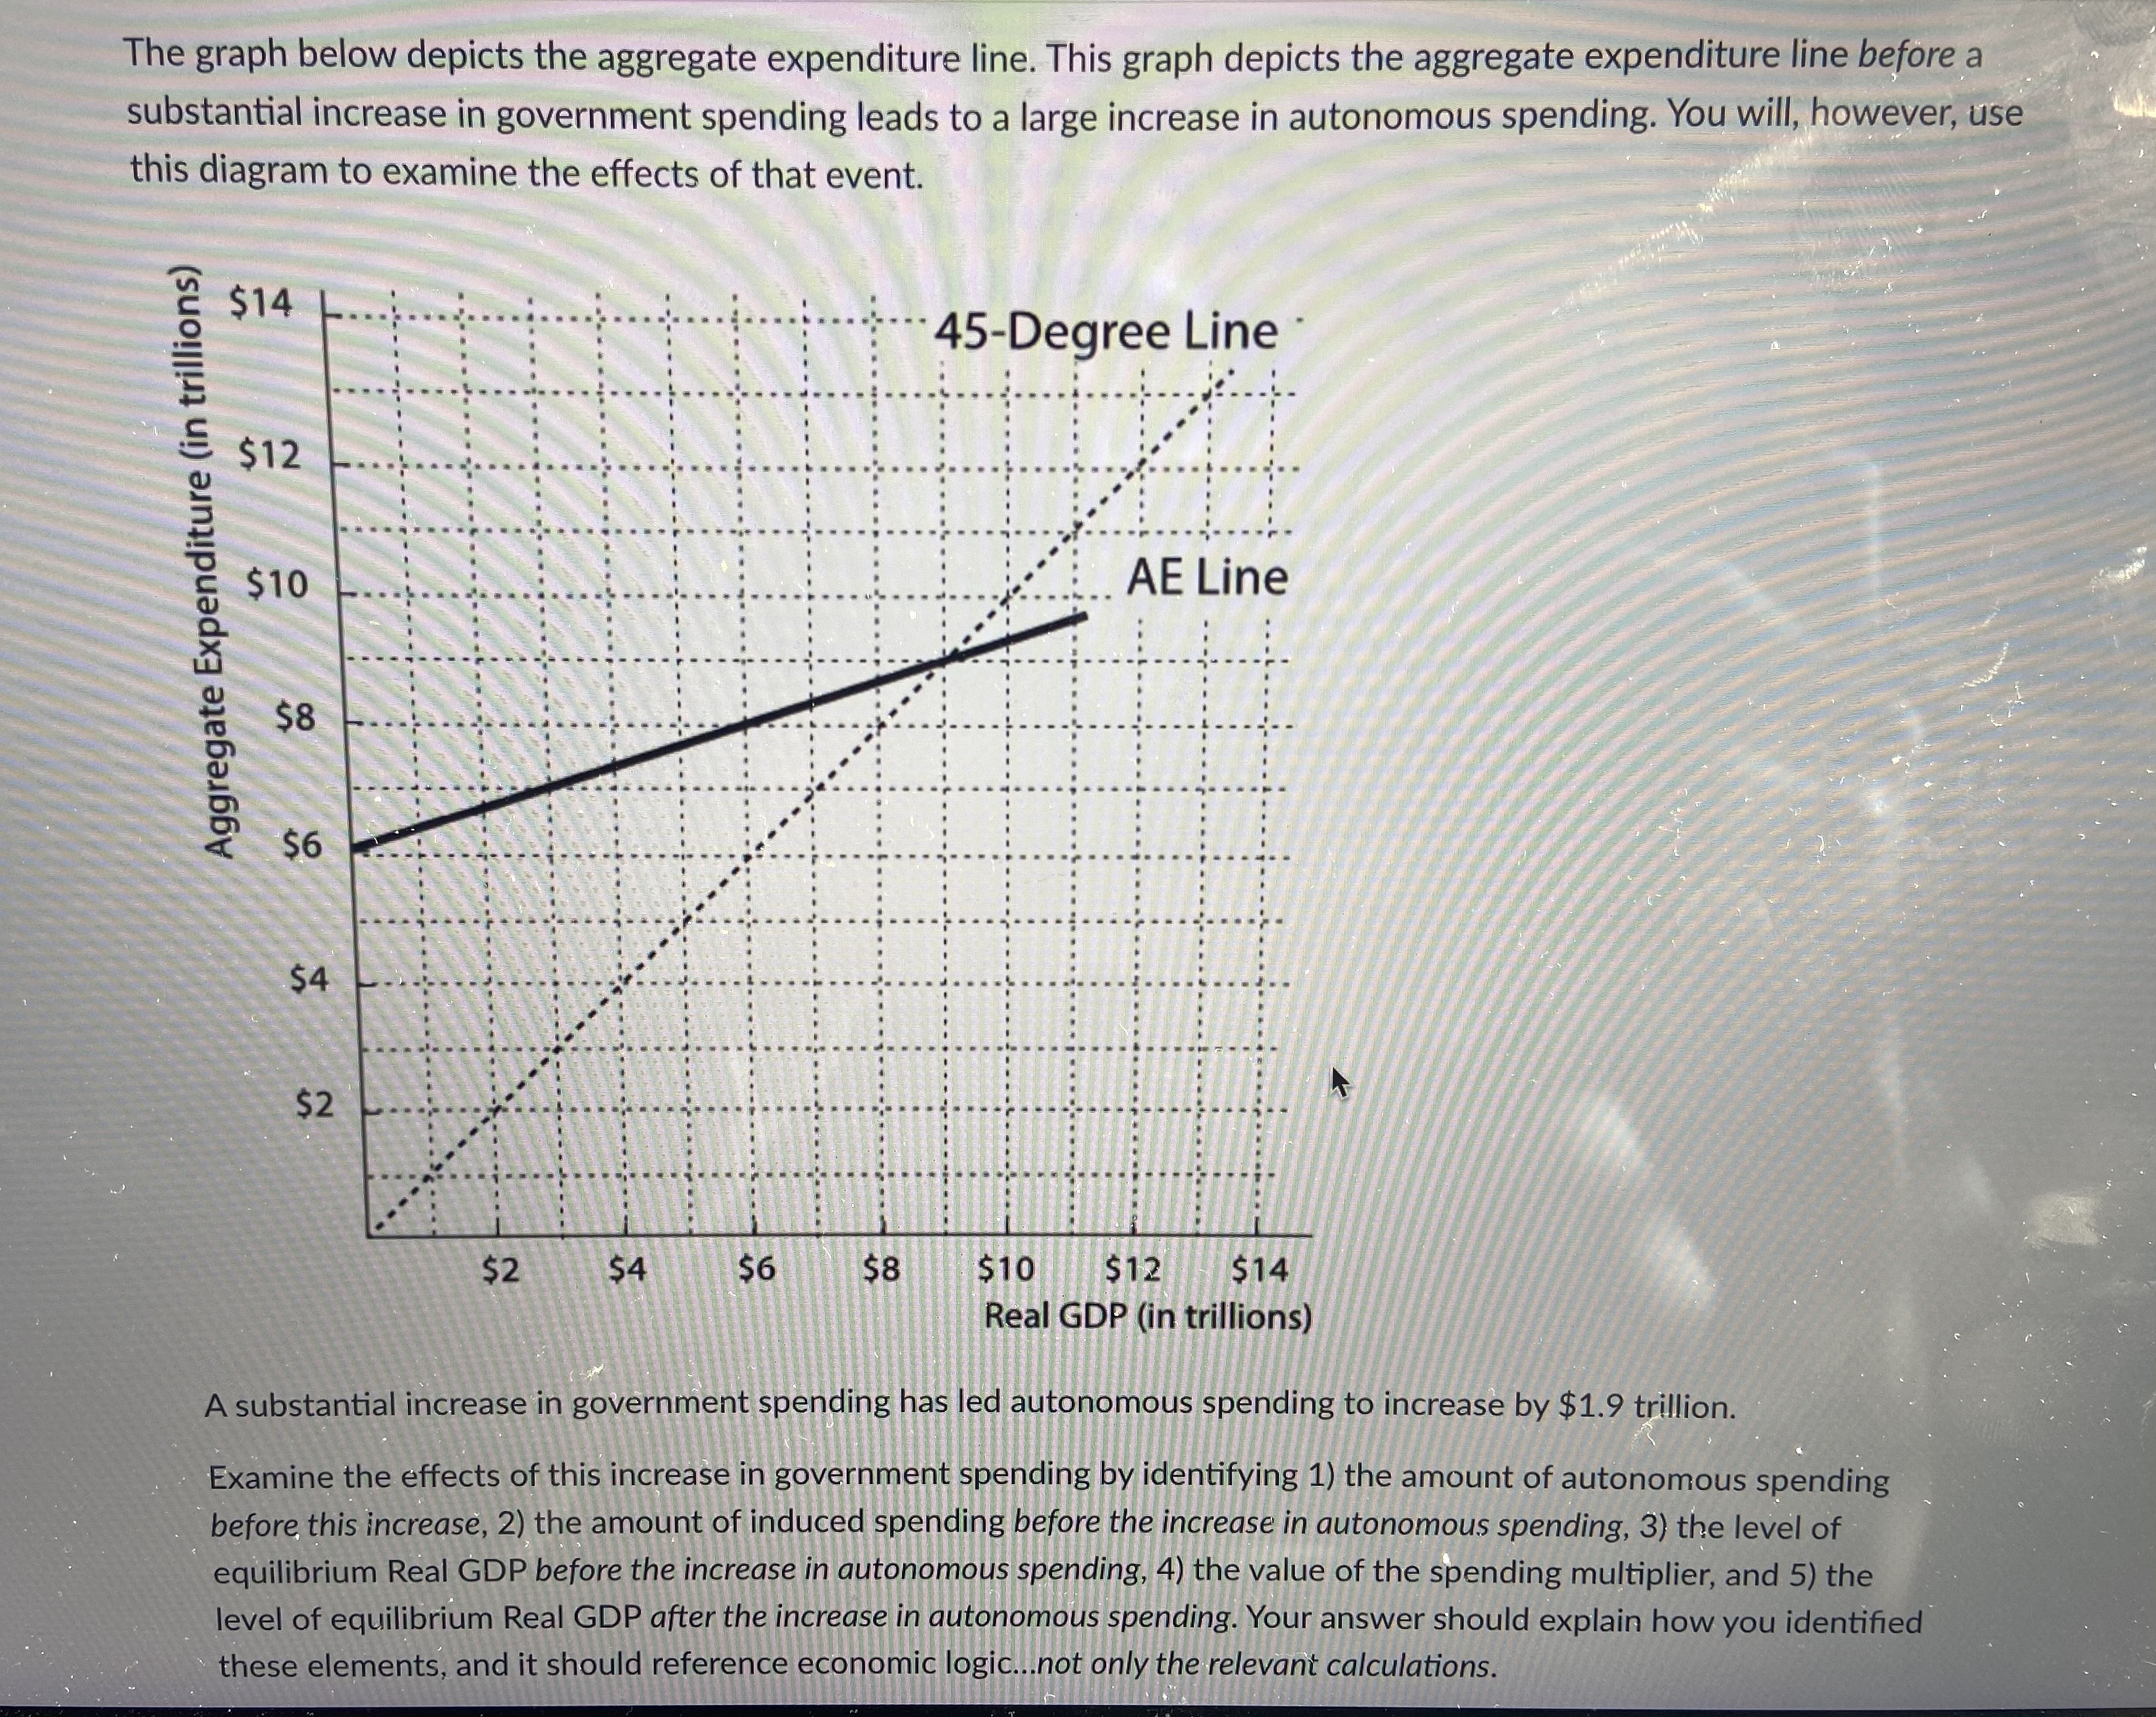
The graph below depicts the aggregate expenditure line. This graph depicts the aggregate expenditure line before a substantial increase in government spending leads to a large increase in autonomous spending. You will, however, use this diagram to examine the effects of that event. $14 .... .-. 45-Degree Line $12 Aggregate Expenditure (in trillions) $10 AE Line $8 $6 $4 $2 $2 $4 $6 $8 $10 $12 $14 Real GDP (in trillions) A substantial increase in government spending has led autonomous spending to increase by $1.9 trillion. Examine the effects of this increase in government spending by identifying 1) the amount of autonomous spending before, this increase, 2) the amount of induced spending before the increase in autonomous spending, 3) the level of equilibrium Real GDP before the increase in autonomous spending, 4) the value of the spending multiplier, and 5) the level of equilibrium Real GDP after the increase in autonomous spending. Your answer should explain how you identified these elements, and it should reference economic logic...not only the relevant calculations
Step by Step Solution
There are 3 Steps involved in it

Get step-by-step solutions from verified subject matter experts