

Question: Please help with this problem. For this assignment, you will need to use the attached file, entitled AAPL & MSFT Annual.xIsx. The file contains the
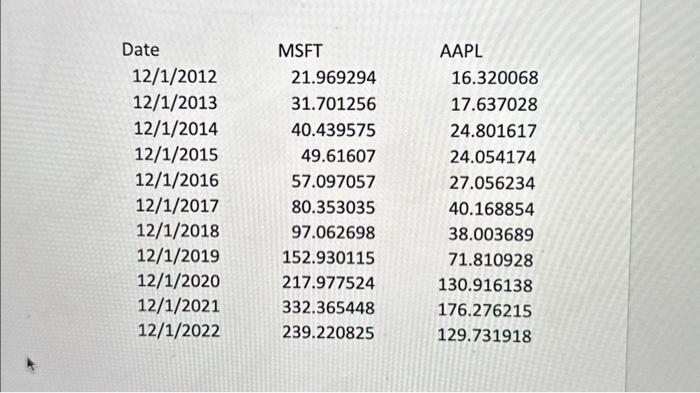
For this assignment, you will need to use the attached file, entitled AAPL \& MSFT Annual.xIsx. The file contains the annual closing stock prices for Apple (AAPL) and Microsoft (MSFT) for the period 20122022. Compute the annual returns for each stock for each year. Find the arithmetic average annual return, the standard deviation of annual returns, and the geometric mean annual return for each stock. Which stock was the better investment over the 2012-2022 period? If you invested $10,000 in each stock at the end of 2012 , how much would each be worth at the end of 2022? The assignment is worth 5 points and is due by 11:59pm on 5 May 2023. AAPL \& MSFT Annual.x|sx \begin{tabular}{lrr} Date & \multicolumn{1}{l}{ MSFT } & \multicolumn{1}{l}{ AAPL } \\ 12/1/2012 & 21.969294 & 16.320068 \\ 12/1/2013 & 31.701256 & 17.637028 \\ 12/1/2014 & 40.439575 & 24.801617 \\ 12/1/2015 & 49.61607 & 24.054174 \\ 12/1/2016 & 57.097057 & 27.056234 \\ 12/1/2017 & 80.353035 & 40.168854 \\ 12/1/2018 & 97.062698 & 38.003689 \\ 12/1/2019 & 152.930115 & 71.810928 \\ 12/1/2020 & 217.977524 & 130.916138 \\ 12/1/2021 & 332.365448 & 176.276215 \\ 12/1/2022 & 239.220825 & 129.731918 \end{tabular} For this assignment, you will need to use the attached file, entitled AAPL \& MSFT Annual.xIsx. The file contains the annual closing stock prices for Apple (AAPL) and Microsoft (MSFT) for the period 20122022. Compute the annual returns for each stock for each year. Find the arithmetic average annual return, the standard deviation of annual returns, and the geometric mean annual return for each stock. Which stock was the better investment over the 2012-2022 period? If you invested $10,000 in each stock at the end of 2012 , how much would each be worth at the end of 2022? The assignment is worth 5 points and is due by 11:59pm on 5 May 2023. AAPL \& MSFT Annual.x|sx \begin{tabular}{lrr} Date & \multicolumn{1}{l}{ MSFT } & \multicolumn{1}{l}{ AAPL } \\ 12/1/2012 & 21.969294 & 16.320068 \\ 12/1/2013 & 31.701256 & 17.637028 \\ 12/1/2014 & 40.439575 & 24.801617 \\ 12/1/2015 & 49.61607 & 24.054174 \\ 12/1/2016 & 57.097057 & 27.056234 \\ 12/1/2017 & 80.353035 & 40.168854 \\ 12/1/2018 & 97.062698 & 38.003689 \\ 12/1/2019 & 152.930115 & 71.810928 \\ 12/1/2020 & 217.977524 & 130.916138 \\ 12/1/2021 & 332.365448 & 176.276215 \\ 12/1/2022 & 239.220825 & 129.731918 \end{tabular}
Step by Step Solution
There are 3 Steps involved in it

Get step-by-step solutions from verified subject matter experts