

Question: Please help with this problem, I am extremely confused. This is a practice problem for my upcoming midterm. (5 points) Weight gain during pregnancy. In
Please help with this problem, I am extremely confused. This is a practice problem for my upcoming midterm.
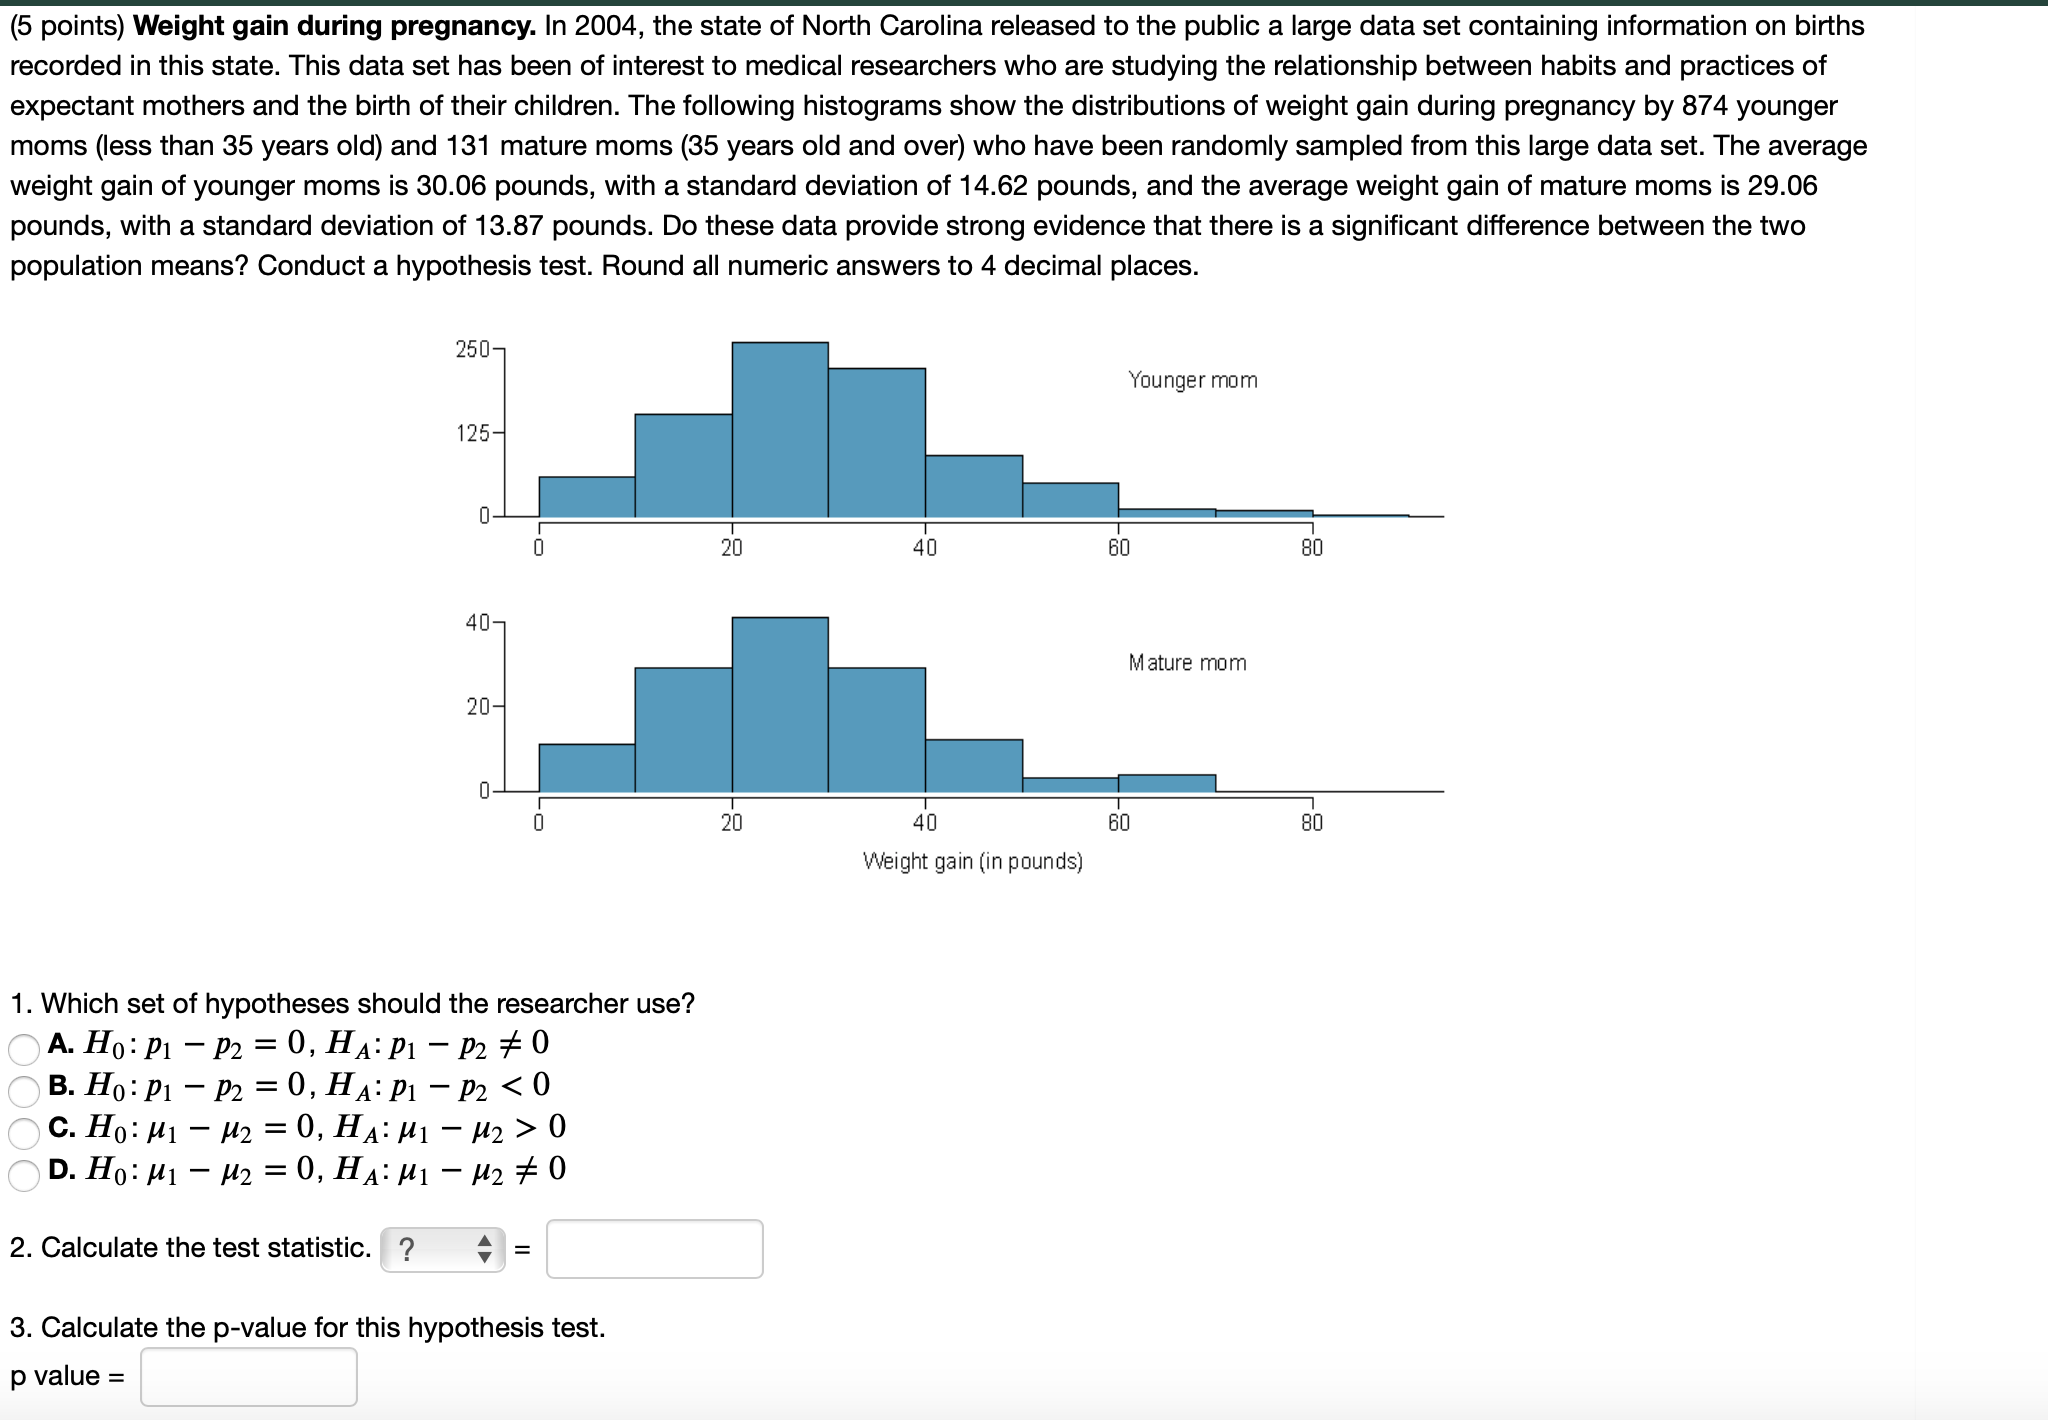
(5 points) Weight gain during pregnancy. In 2004, the state of North Carolina released to the public a large data set containing information on births recorded in this state. This data set has been of interest to medical researchers who are studying the relationship between habits and practices of expectant mothers and the birth of their children. The following histograms show the distributions of weight gain during pregnancy by 874 younger moms (less than 35 years old) and 131 mature moms (35 years old and over) who have been randomly sampled from this large data set. The average weight gain of younger moms is 30.06 pounds, with a standard deviation of 14.62 pounds, and the average weight gain of mature moms is 29.06 pounds, with a standard deviation of 13.87 pounds. Do these data provide strong evidence that there is a significant difference between the two population means? Conduct a hypothesis test. Round all numeric answers to 4 decimal places. 250- Younger mom 125- 20 40 60 80 40- Mature mom 20- 20 40 60 80 Weight gain (in pounds) 1. Which set of hypotheses should the researcher use? OA. Ho : P1 - P2 = 0, HA: PI - P2 # 0 OB. Ho : P1 - P2 = 0, HA: PI - P2 0 OD. HO: M1 - M2 = 0, HA: M1 - M2 # 0 2. Calculate the test statistic. ? 3. Calculate the p-value for this hypothesis test. p value =
Step by Step Solution
There are 3 Steps involved in it

Get step-by-step solutions from verified subject matter experts