Question: Please help with this quantitative analysis for business homework Show your work/steps clearly in order to receive credit. 1. Apply the Northwest Corner (NWC) rule
Please help with this quantitative analysis for business homework
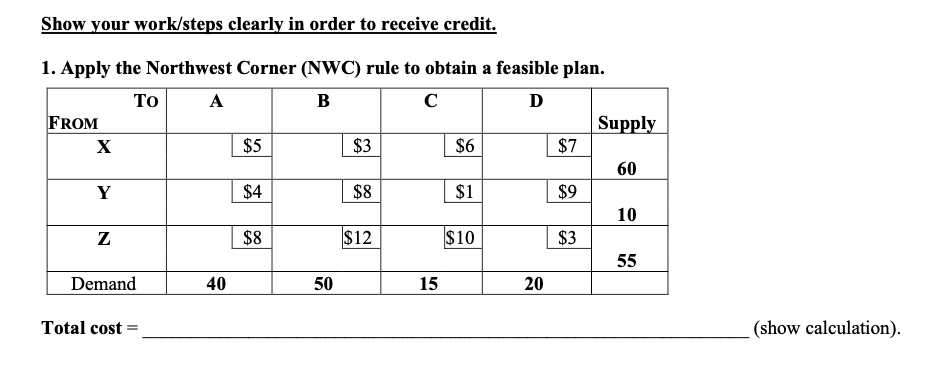
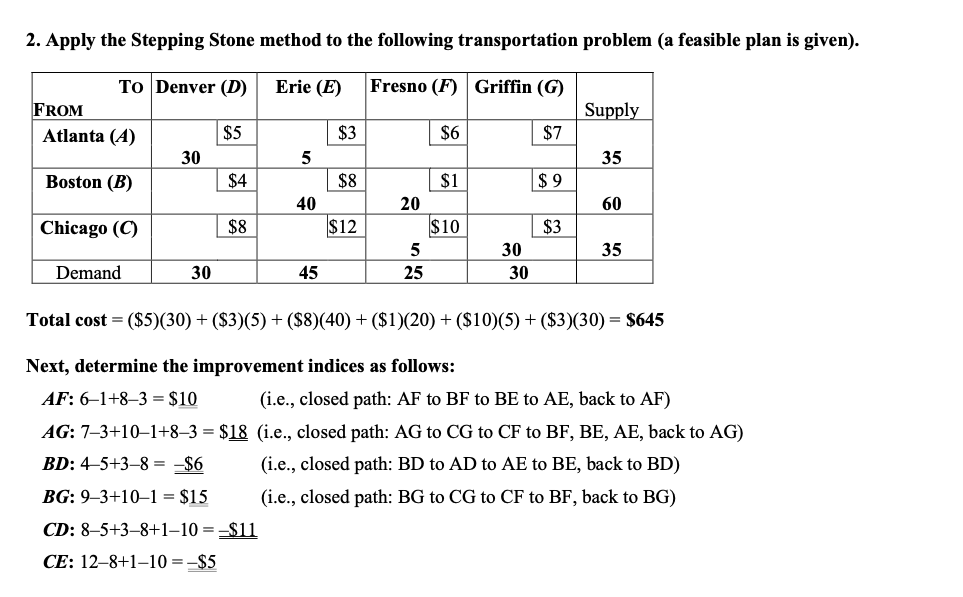
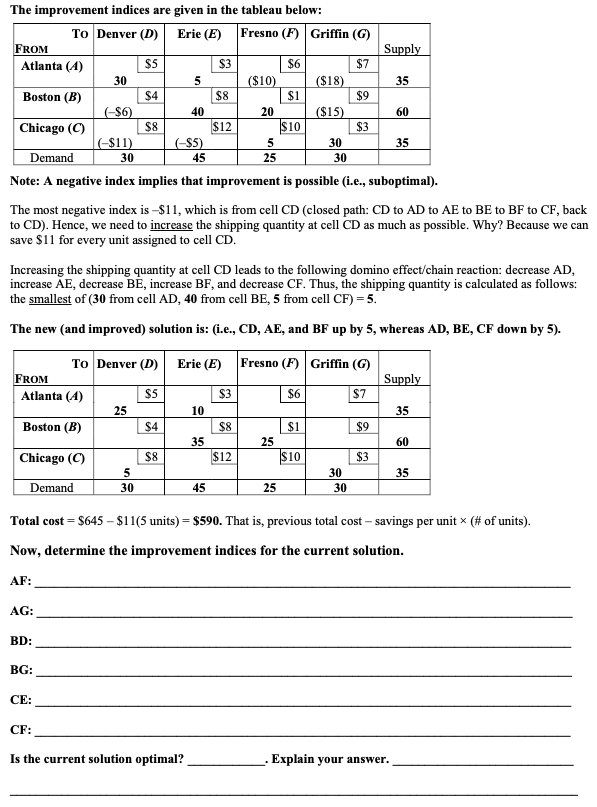
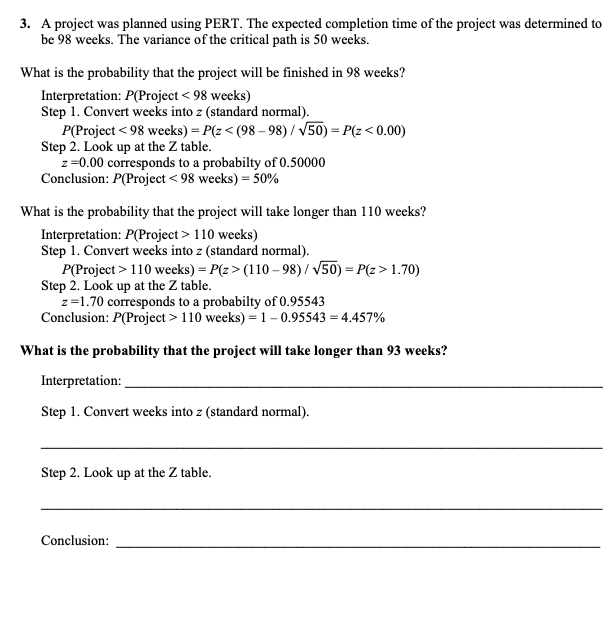
Show your work/steps clearly in order to receive credit. 1. Apply the Northwest Corner (NWC) rule to obtain a feasible plan. TO A B FROM Supply $5 $3 $6 $7 Y $4 $8 $1 $9 Z $8 $12 $10 $3 Demand 40 50 15 20 Total cost = (show calculation). 2. Apply the Stepping Stone method to the following transportation problem (a feasible plan is given). Supply To Denver (D) Erie (E) Fresno (F) Griffin (G) FROM Atlanta (A) $5 $3 $6 $7 305 Boston (B) $4 $8 $1 $9 40 20 Chicago (C) $12 $10 $3 5 30 Demand 30 45 125 1 30 60 $8 Total cost = ($5)(30) + ($3)(5) + ($8)(40) + ($1)(20) + ($10)(5) + ($3)(30) = $645 Next, determine the improvement indices as follows: AF: 6-1+83 = $10 (i.e., closed path: AF to BF to BE to AE, back to AF) AG: 73+101+83 = $18 (i.e., closed path: AG to CG to CF to BF, BE, AE, back to AG) BD: 45+38 = -$6 (i.e., closed path: BD to AD to AE to BE, back to BD) BG: 93+101 = $15 (i.e., closed path: BG to CG to CF to BF, back to BG) CD: 85+38+110 ==$11 CE: 128+1-10 = -$5 $3 $7 The improvement indices are given in the tableau below: To Denver (D) Erie (E) Fresno (F) Griffin (G) FROM Supply Atlanta (4) $5 $6 30 ($18) Boston (B) (-$6) 20 ($15) Chicago (C) $8 $10 $3 (-$11) (-$5) 5 30 Demand | 30 | 45 | 25 | 30 Note: A negative index implies that improvement is possible (i.e., suboptimal). $4 $12 The most negative index is $11, which is from cell CD (closed path: CD to AD to AE to BE to BF to CF, back to CD). Hence, we need to increase the shipping quantity at cell CD as much as possible. Why? Because we can save $11 for every unit assigned to cell CD. Increasing the shipping quantity at cell CD leads to the following domino effect/chain reaction: decrease AD, increase AE, decrease BE, increase BF, and decrease CF. Thus, the shipping quantity is calculated as follows: the smallest of (30 from cell AD, 40 from cell BE, 5 from cell CF) = 5. The new and improved) solution is: (i.e., CD, AE, and BF up by 5, whereas AD, BE, CF down by 5). Erie (E) To Denver (D) FROM Atlanta (4) Fresno (F) Griffin (6) S6 S7 Supply SS $3 25 Boston (B) $1 $9 25 Chicago (C) $8 $12 $ 10 $3 30 Demand | 30 | 45 | 25 | 30 Total cost = $645 - $11(5 units) - $590. That is, previous total cost savings per unitx (# of units). Now, determine the improvement indices for the current solution. CF: Is the current solution optimal? __ _. Explain your answer. 3. A project was planned using PERT. The expected completion time of the project was determined to be 98 weeks. The variance of the critical path is 50 weeks. What is the probability that the project will be finished in 98 weeks? Interpretation: P(Project 110 weeks) Step 1. Convert weeks into z (standard normal). P(Project > 110 weeks) = P(z>(110-98)/50)=P(z> 1.70) Step 2. Look up at the Z table. z=1.70 corresponds to a probabilty of 0.95543 Conclusion: P(Project > 110 weeks) = 1 -0.95543 = 4.457% What is the probability that the project will take longer than 93 weeks? Interpretation: Step 1. Convert weeks into z (standard normal). Step 2. Look up at the Z table. Conclusion


