

Question: Please help with this question. 1 Quantitative Analysis Problem #1 (10 points) Demand Forecasting: Use the information provided to answer the following questions. a. What
Please help with this question.
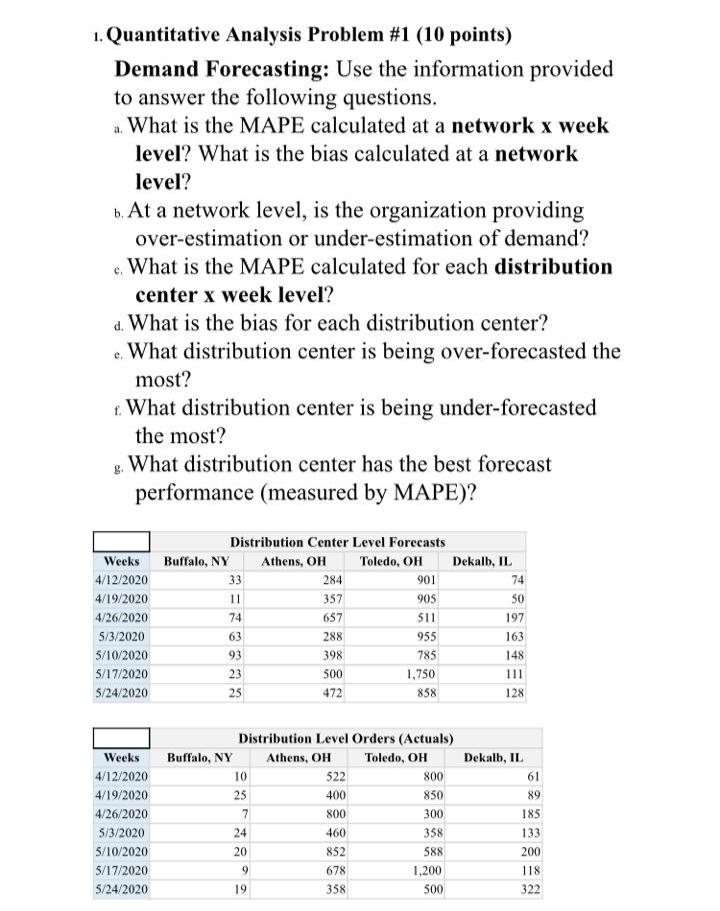
1 Quantitative Analysis Problem #1 (10 points) Demand Forecasting: Use the information provided to answer the following questions. a. What is the MAPE calculated at a network x week level? What is the bias calculated at a network level? b. At a network level, is the organization providing over-estimation or under-estimation of demand? .. What is the MAPE calculated for each distribution center x week level? d. What is the bias for each distribution center? What distribution center is being over-forecasted the most? 1. What distribution center is being under-forecasted the most? What distribution center has the best forecast performance (measured by MAPE)? Weeks 4/12/2020 4/19/2020 4/26/2020 5/3/2020 5/10/2020 5/17/2020 5/24/2020 Distribution Center Level Forecasts Buffalo, NY Athens, OH Toledo, OH Dekalb, IL 284 901 357 905 657 511 288 955 398 785 500 1,750 472 858 128 197 148 Dekalb, IL Weeks 4/12/2020 4/19/2020 4/26/2020 5/3/2020 5/10/2020 5/17/2020 5/24/2020 Distribution Level Orders (Actuals) Buffalo, NY Athens, OH "Toledo, OH 522 800 400 850 800 300 460 358 588 678 1,200 358 500 852 185 133 200 118 322Step by Step Solution
There are 3 Steps involved in it
1 Expert Approved Answer
Step: 1 Unlock

Question Has Been Solved by an Expert!
Get step-by-step solutions from verified subject matter experts
Step: 2 Unlock
Step: 3 Unlock