

Question: Please help with this. Question 3 0/4 pts ) 3 4 Details The graph illustrates the distribution of test scores taken by College Algebra students.
Please help with this.
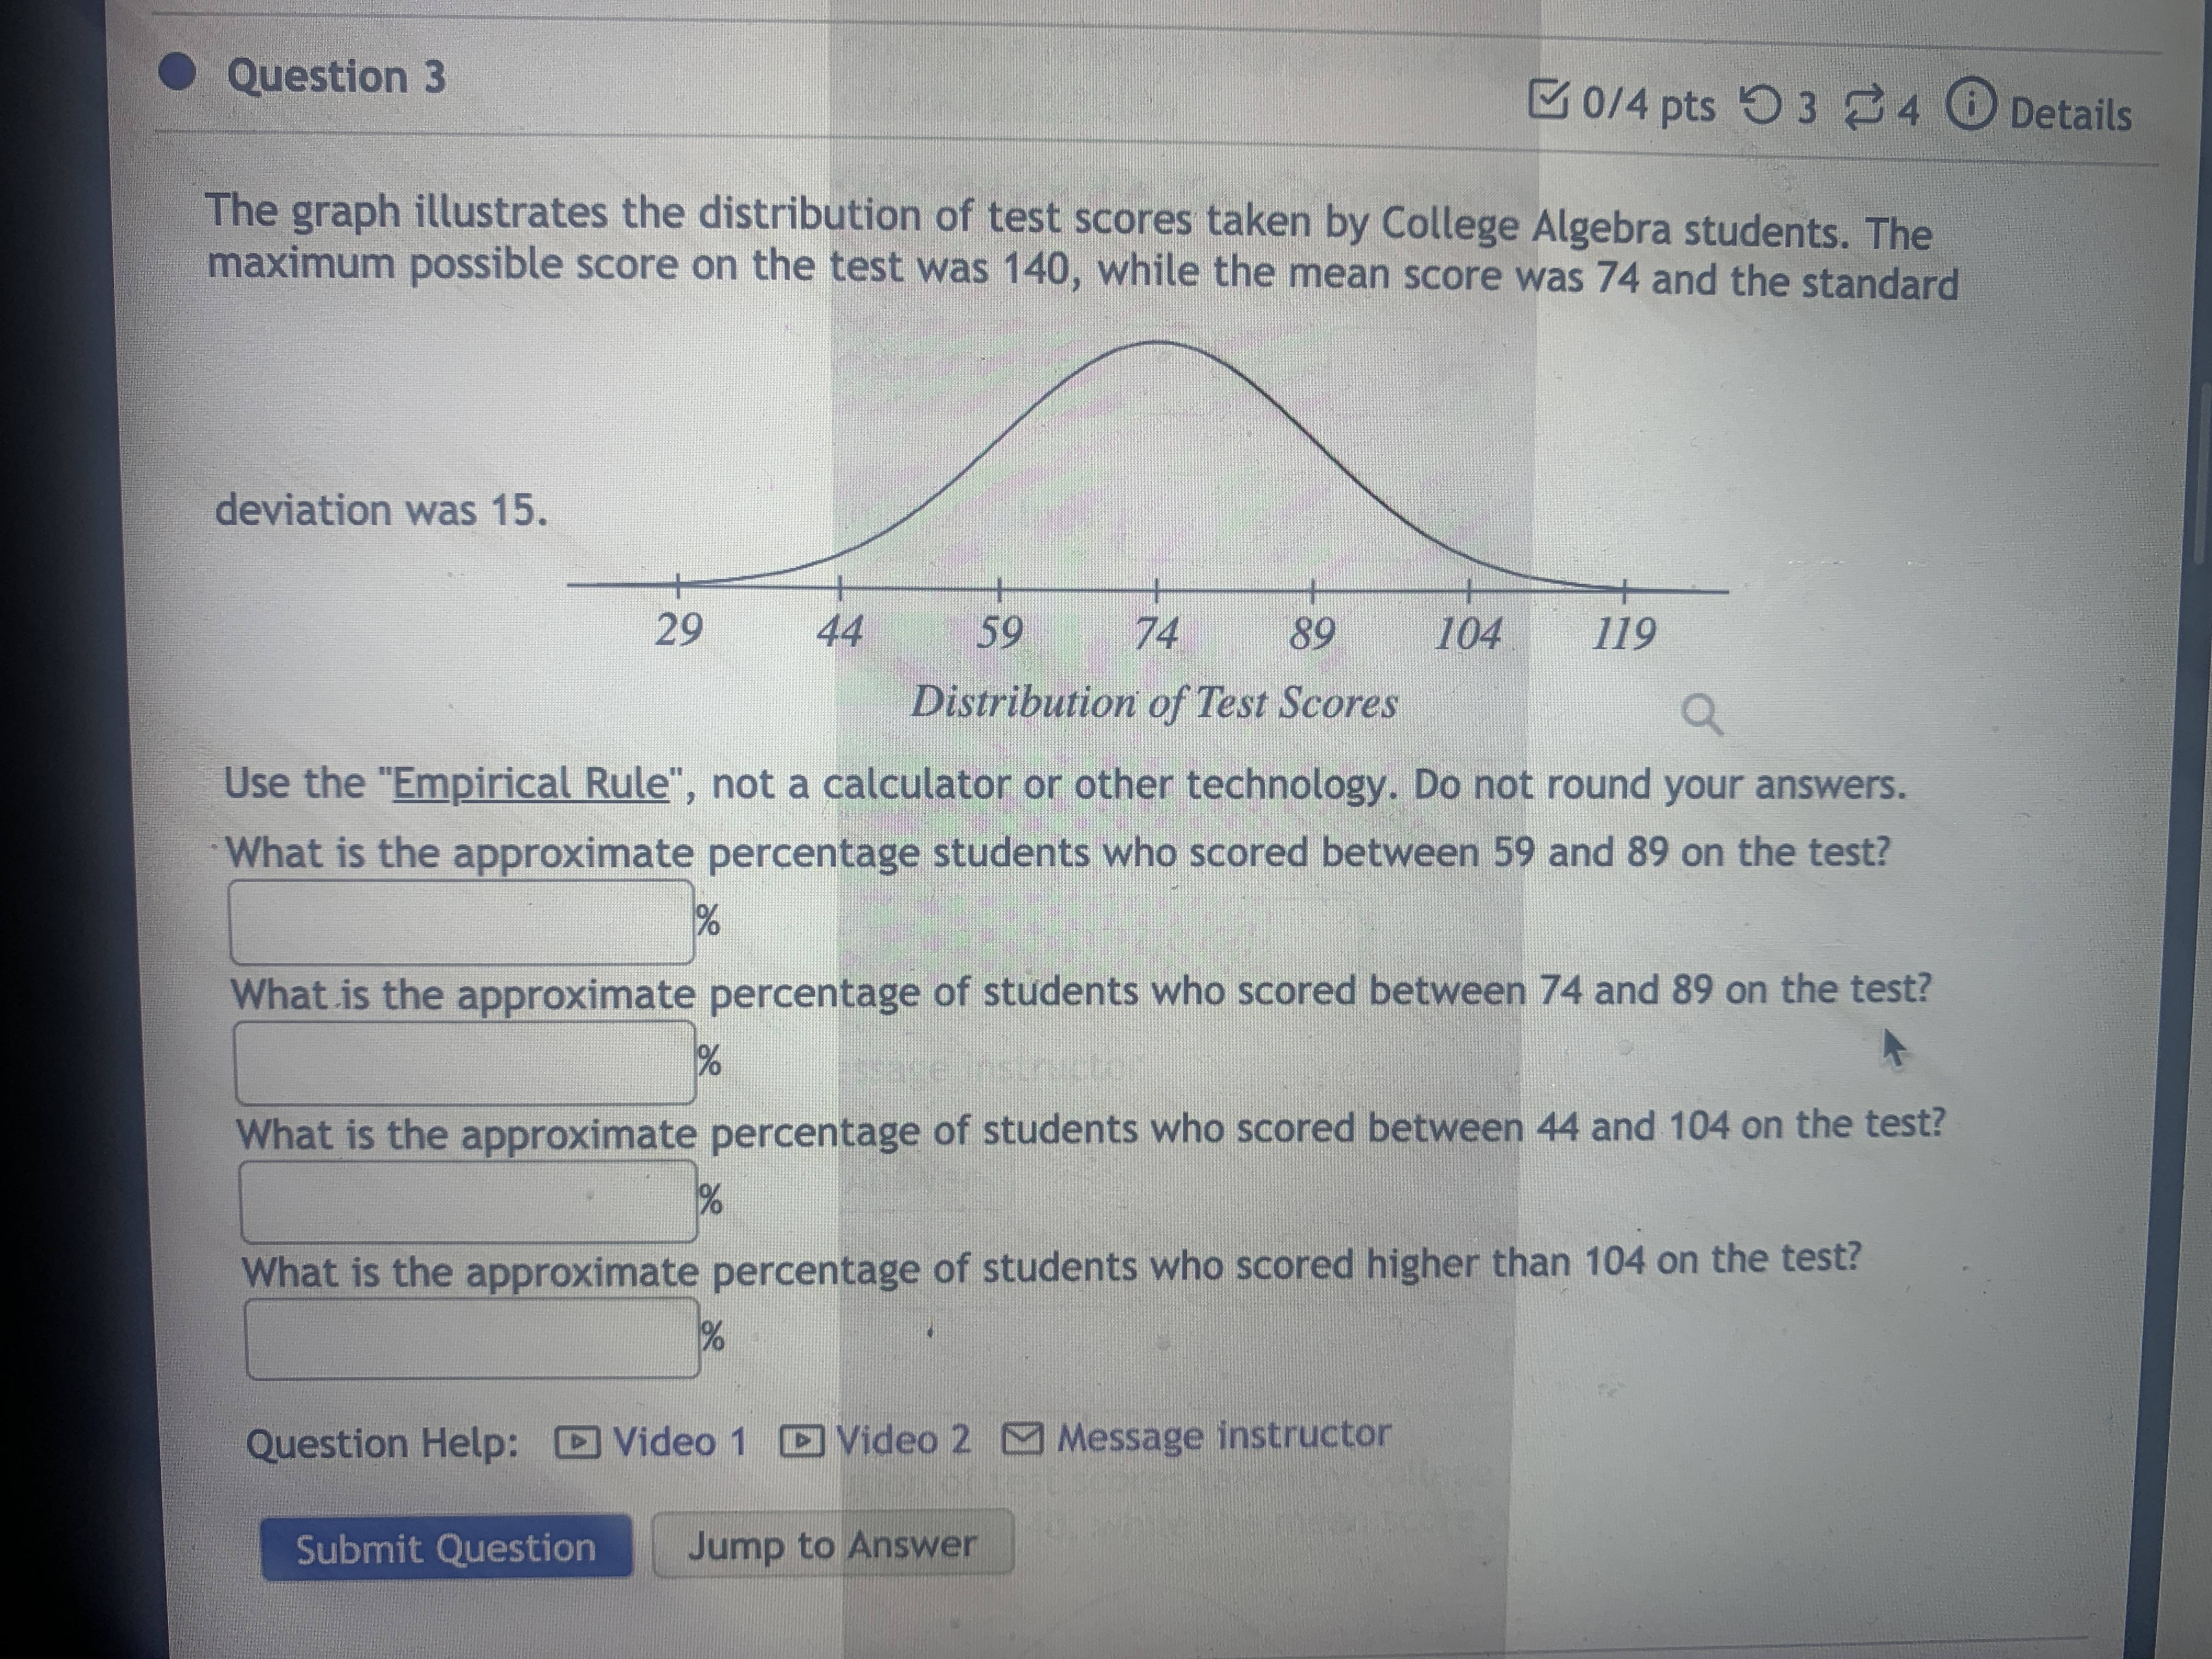
Question 3 0/4 pts ) 3 4 Details The graph illustrates the distribution of test scores taken by College Algebra students. The maximum possible score on the test was 140, while the mean score was 74 and the standard deviation was 15. 29 44 59 74 89 104 119 Distribution of Test Scores Q Use the "Empirical Rule", not a calculator or other technology. Do not round your answers. What is the approximate percentage students who scored between 59 and 89 on the test? What is the approximate percentage of students who scored between 74 and 89 on the test? What is the approximate percentage of students who scored between 44 and 104 on the test? What is the approximate percentage of students who scored higher than 104 on the test? Question Help: Video 1 ]Video 2 Message instructor Submit Question Jump to
Step by Step Solution
There are 3 Steps involved in it

Get step-by-step solutions from verified subject matter experts