

Question: please help with this question 7a. 7b. 7c. 7d. thank you 7. The article Wait Times on Rise to See Doctor (USA Today, June 4,
please help with this question 7a. 7b. 7c. 7d. thank you
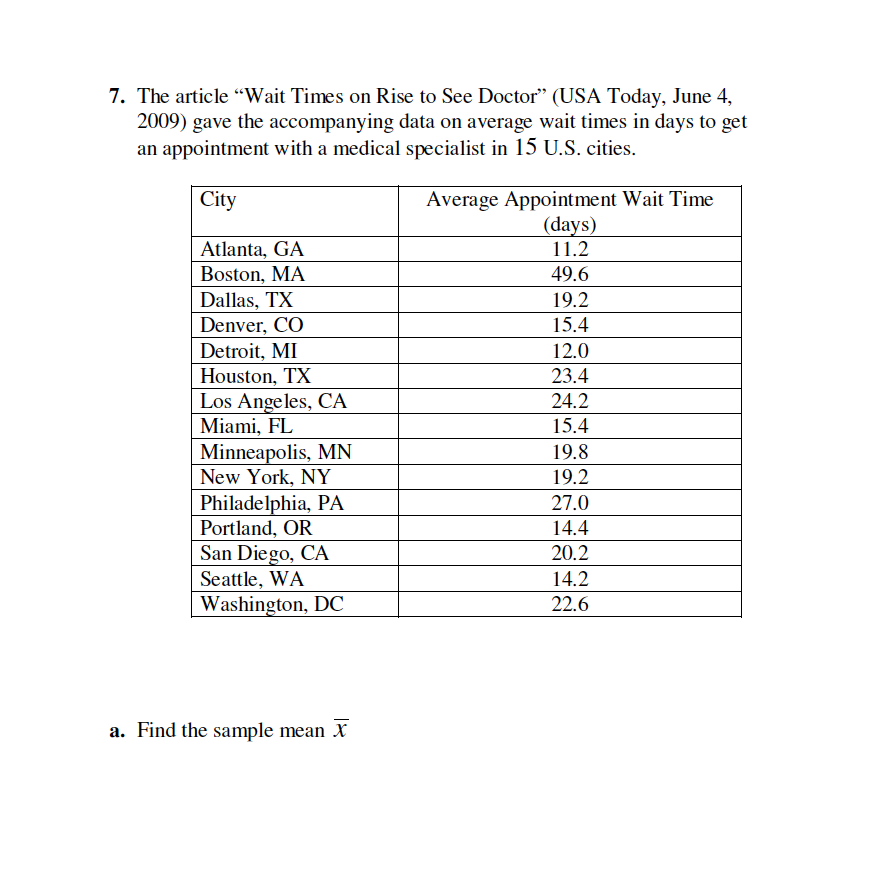
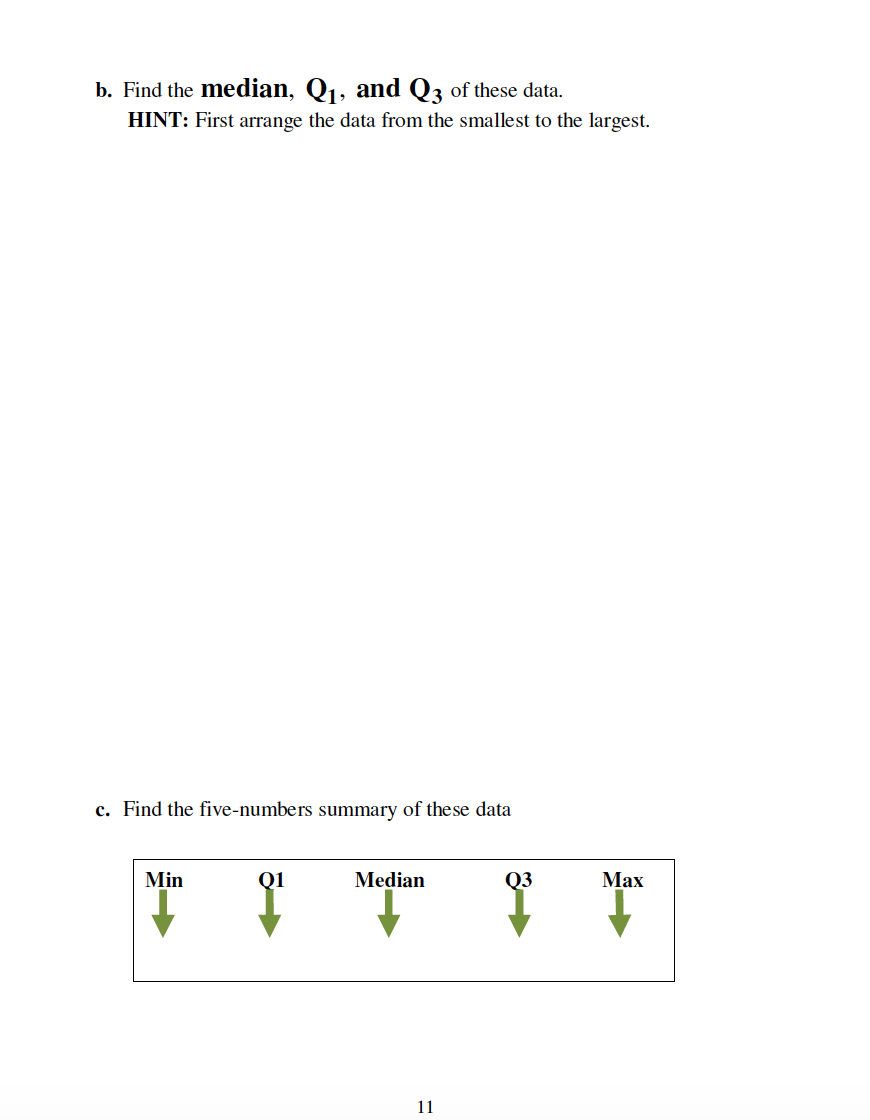
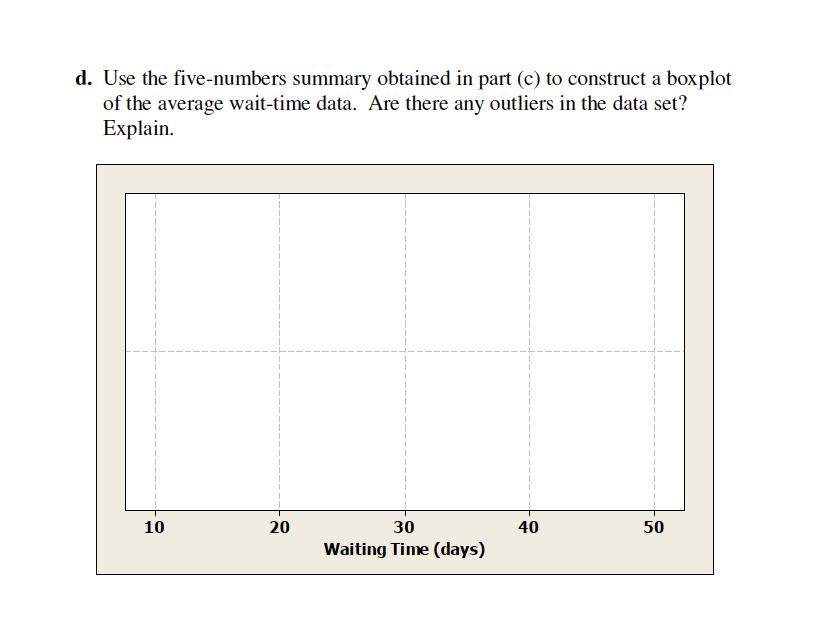
7. The article "Wait Times on Rise to See Doctor" (USA Today, June 4, 2009) gave the accompanying data on average wait times in days to get an appointment with a medical specialist in 15 U.S. cities. City Average Appointment Wait Time (days) Atlanta, GA 11.2 Boston, MA 49.6 Dallas, TX 19.2 Denver, CO 15.4 Detroit, MI 12.0 Houston, TX 23.4 Los Angeles, CA 24.2 Miami, FL 15.4 Minneapolis, MN 19.8 New York, NY 19.2 Philadelphia, PA 27.0 Portland, OR 14.4 San Diego, CA 20.2 Seattle, WA 14.2 Washington, DC 22.6 a. Find the sample mean Xb. Find the median, Q1, and Q3 of these data. HINT: First arrange the data from the smallest to the largest. c. Find the five-numbers summary of these data Min Q1 Median Q3 Max 11d. Use the five-numbers summary obtained in part (c) to construct a boxplot of the average wait-time data. Are there any outliers in the data set? Explain. 10 20 30 40 50 Waiting Time (days)
Step by Step Solution
There are 3 Steps involved in it

Get step-by-step solutions from verified subject matter experts