

Question: Please help with this question: Calculate descriptive statistics for the data. Do not round intermediate calculations. Round your answers to four decimal places, when needed.
Please help with this question:
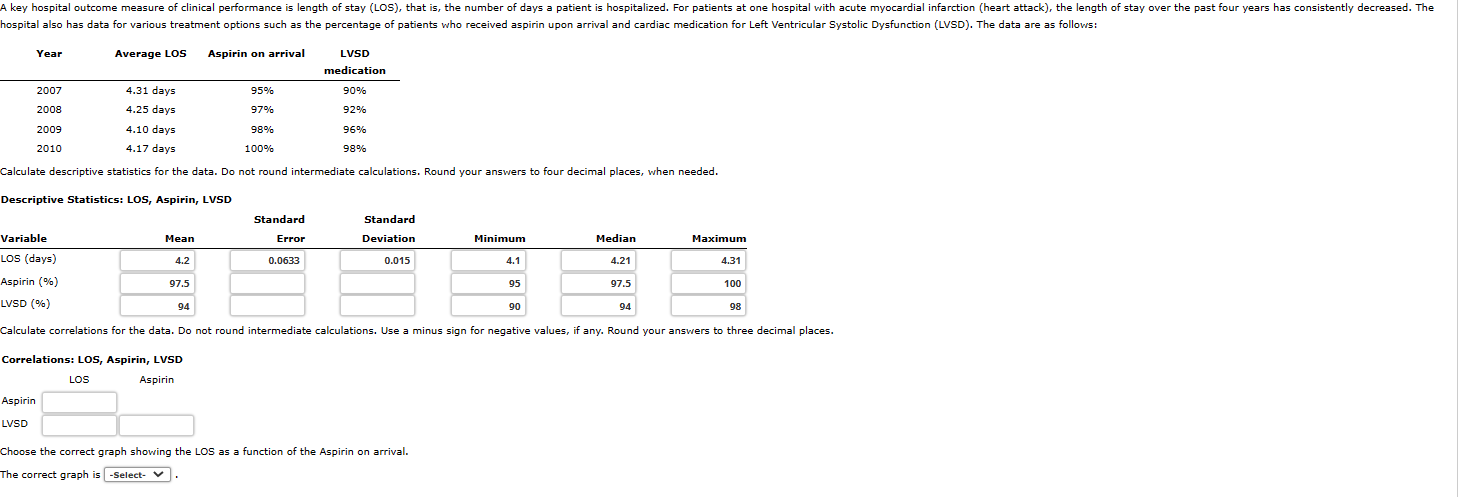
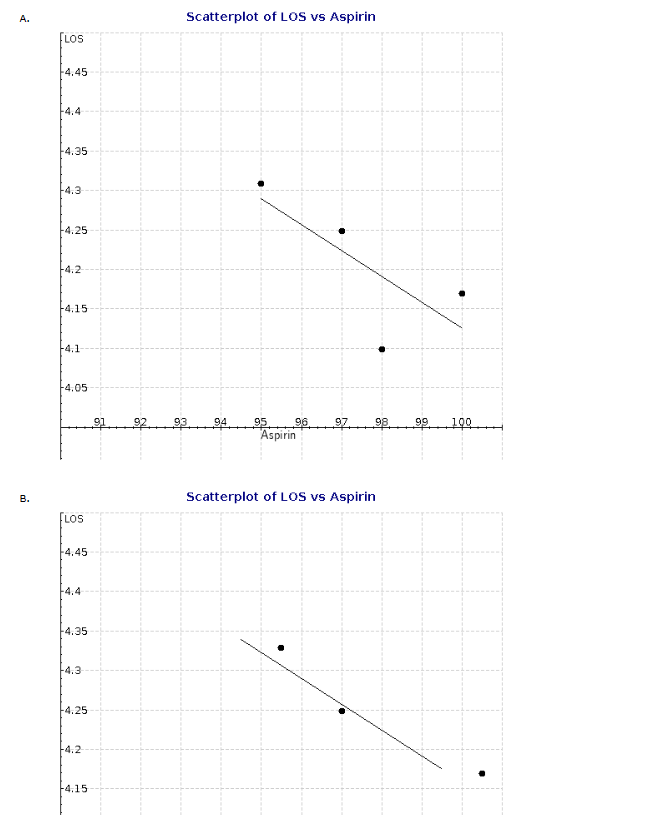
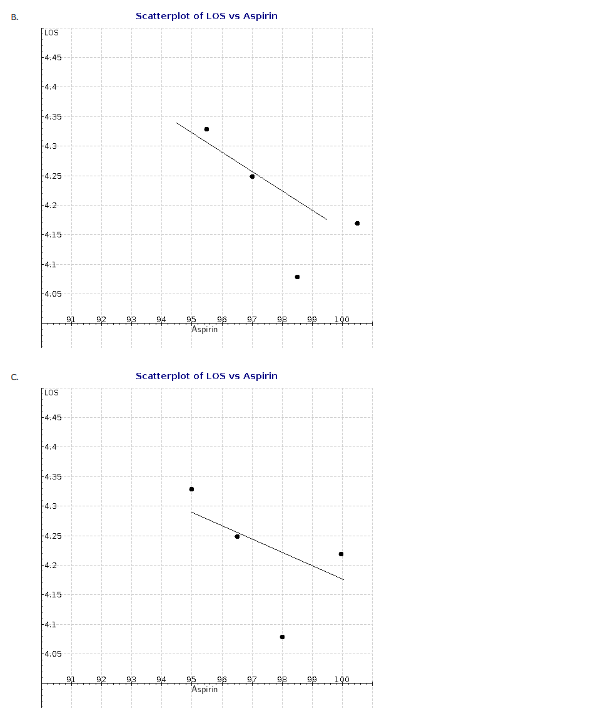
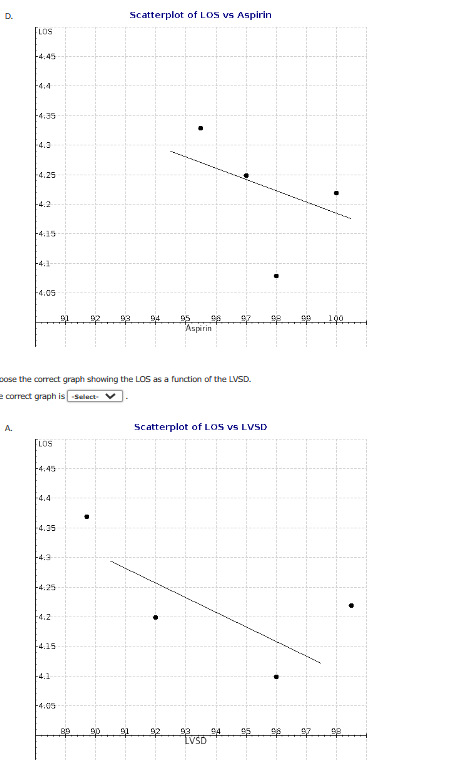
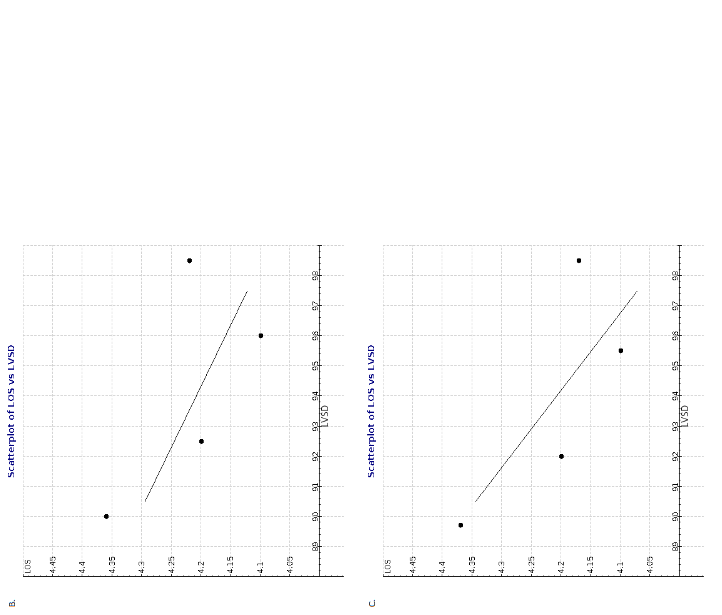
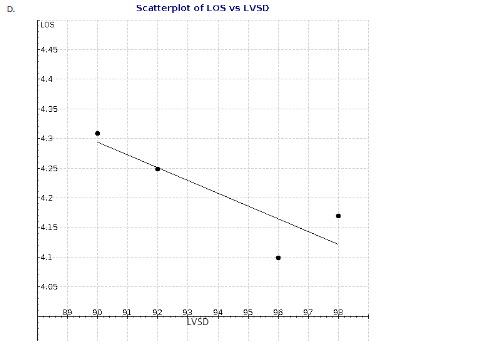
Calculate descriptive statistics for the data. Do not round intermediate calculations. Round your answers to four decimal places, when needed. Descriptive Statistics: LOS, Aspirin, LVSD Calculate correlations for the data. Do not round intermediate calculations. Use a minus sign for negative values, if any. Round your answers to thr Choose the correct graph showing the LOS as a function of the Aspirin on arrival. The correct graph is A. Scatterplot of LOS vS Aspirin B. Scatterplot of LOS vs Aspirin c. Scatterplot of LOS vs Aspirin wose the correct graph showing the LOS as a function of the LVSD. correct graph is B. Scatterplot of LOS vS LVSD C. Scatterplot of LOS vS LVSD D. Scatterplot of LOS vS LVSD
Step by Step Solution
There are 3 Steps involved in it

Get step-by-step solutions from verified subject matter experts