

Question: Please help with this question for my bus statistics class. Question Help The following table compares fuel economy as calculated by car owners and by
Please help with this question for my bus statistics class.
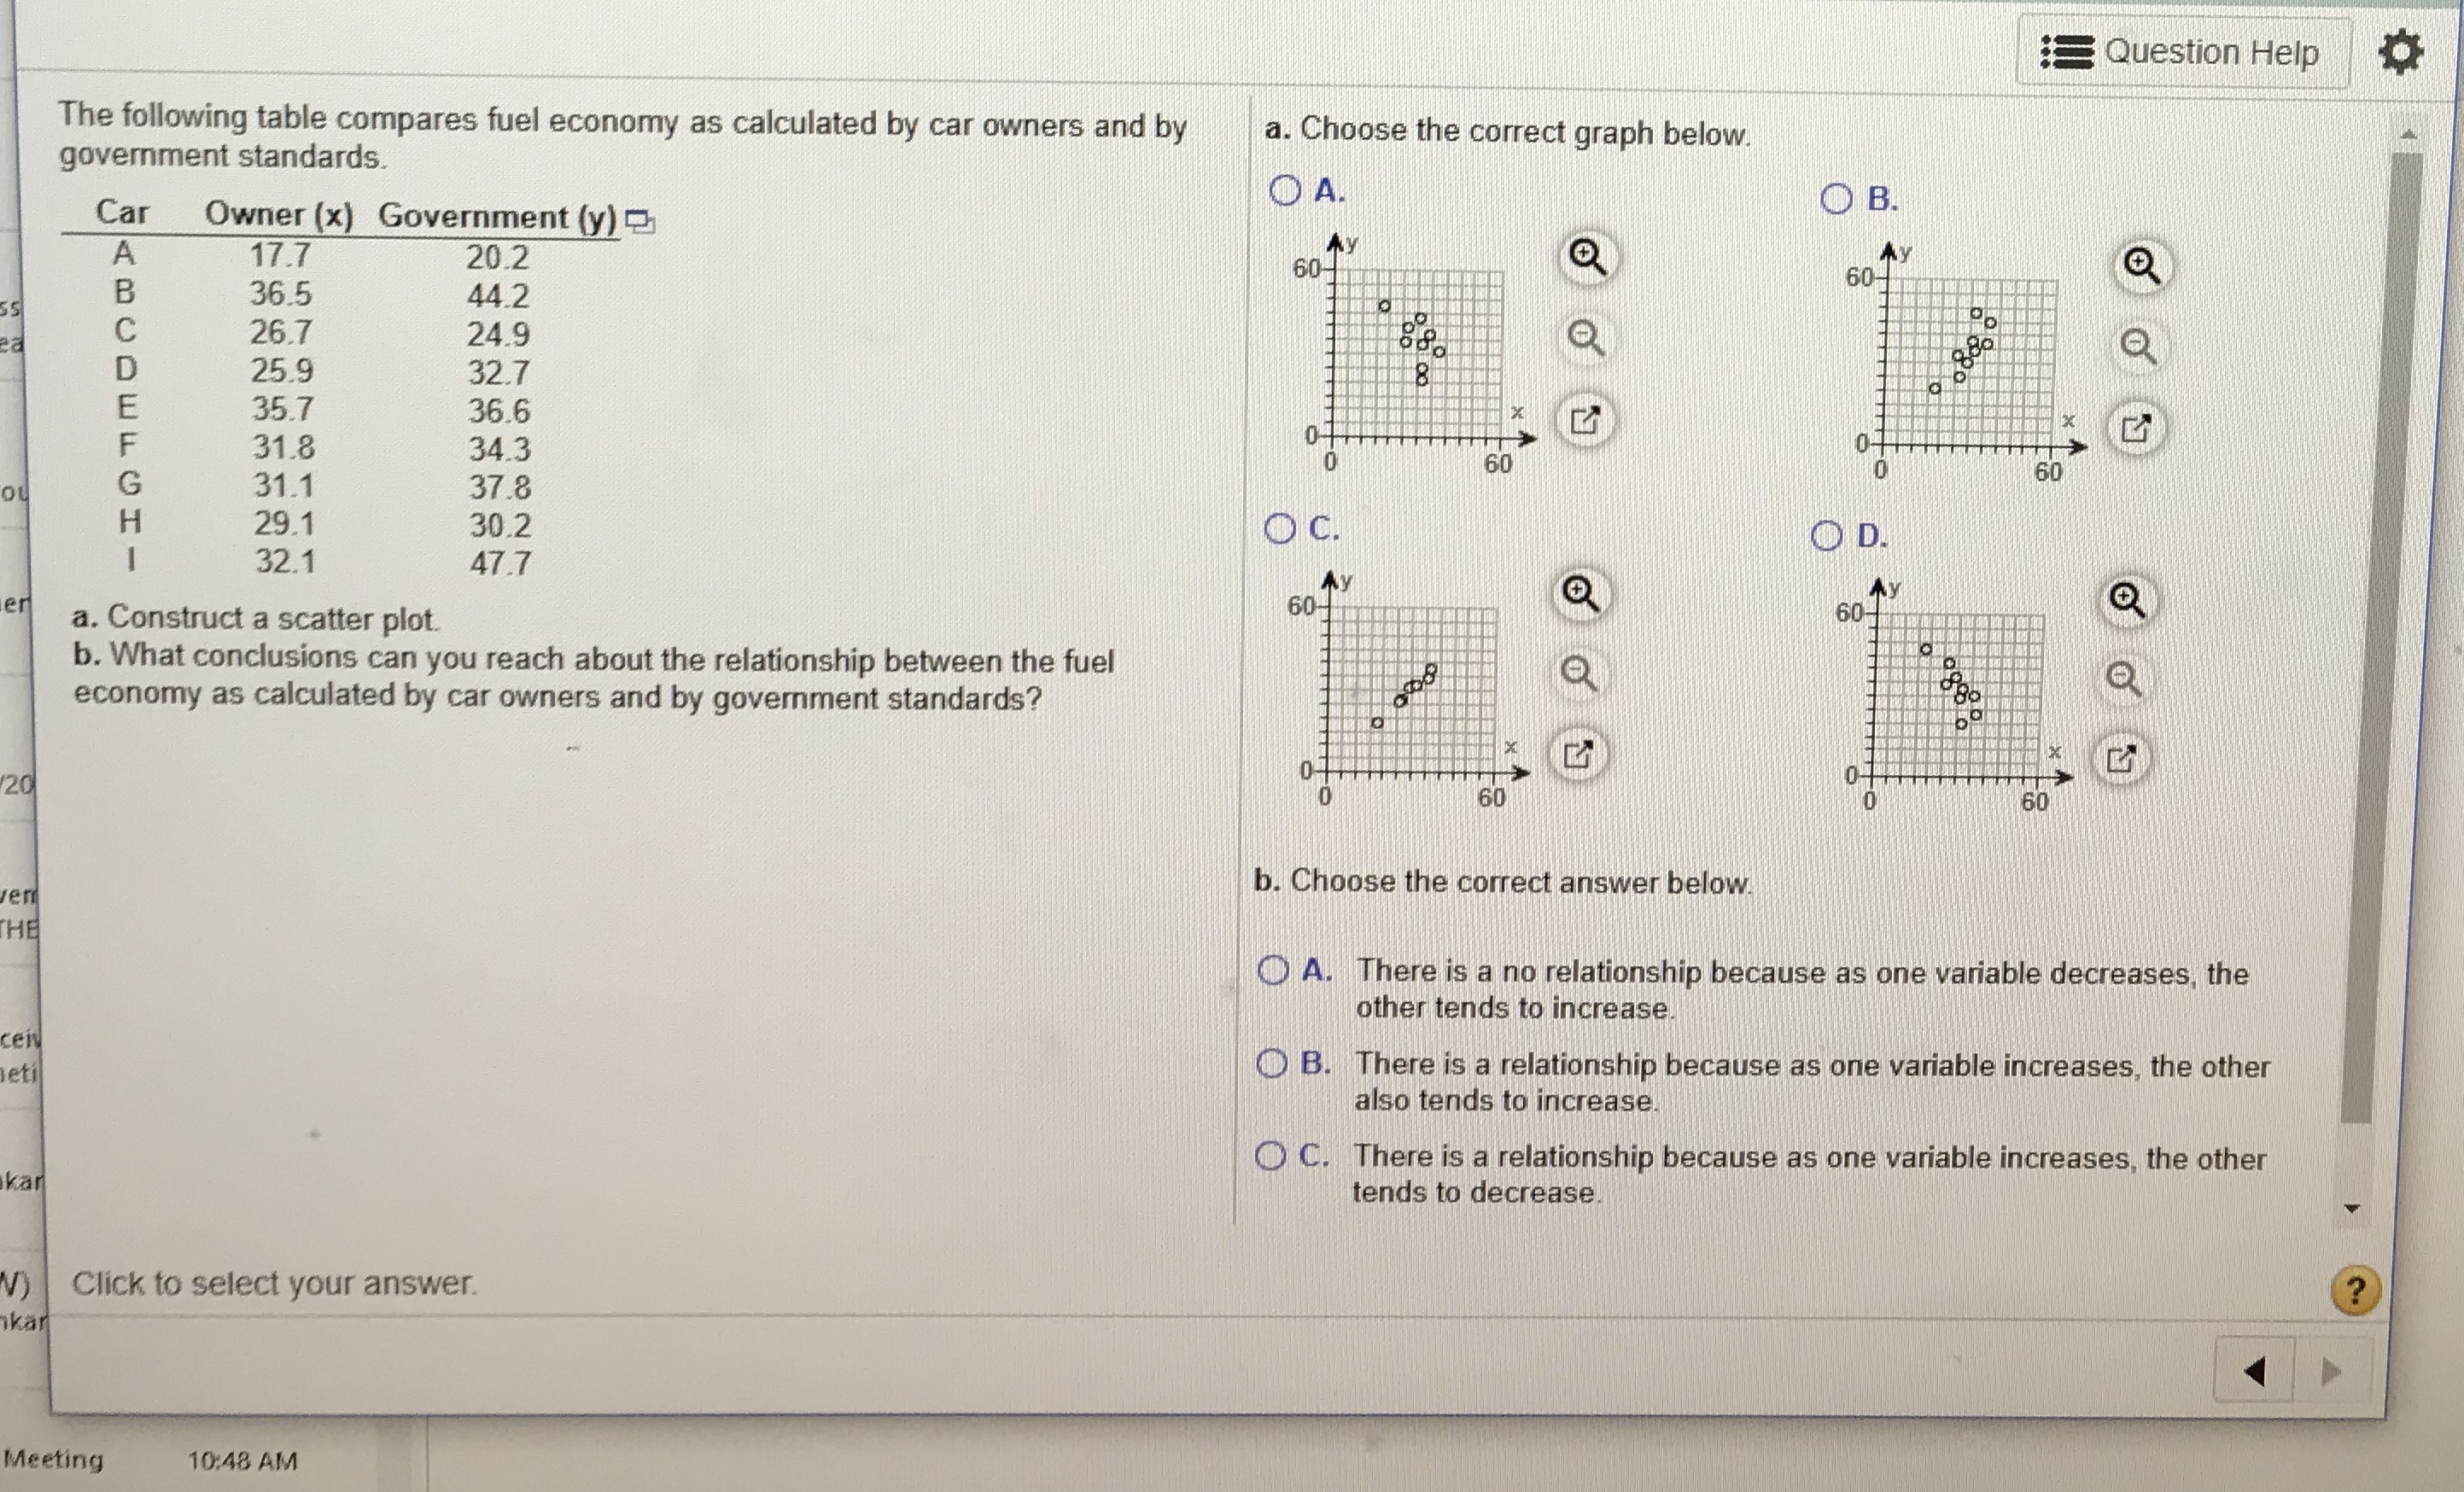
Question Help The following table compares fuel economy as calculated by car owners and by government standards. a. Choose the correct graph below. Car Owner (x) Government (y) OA. OB. A 17.7 20.2 60- Ay B 36.5 44.2 60- -IOTMO 26.7 24.9 25.9 32.7 35.7 36.6 31.8 34.3 31.1 37.8 29.1 30.2 OC. 32.1 OD. 47.7 Ay er a. Construct a scatter plot. 60- 60- b. What conclusions can you reach about the relationship between the fuel economy as calculated by car owners and by government standards? 20 60 ren b. Choose the correct answer below. THE O A. There is a no relationship because as one variable decreases, the other tends to increase. letil O B. There is a relationship because as one variable increases, the other also tends to increase. O C. There is a relationship because as one variable increases, the other kar tends to decrease V) Click to select your answer. ? ikar Meeting 10:48 AM
Step by Step Solution
There are 3 Steps involved in it

Get step-by-step solutions from verified subject matter experts