

Question: Please help with this regression analysis problem. Any help is greatly appreciated, even if all 5 parts aren't necessarily answered. Q2. The dataset trees contains
Please help with this regression analysis problem. Any help is greatly appreciated, even if all 5 parts aren't necessarily answered.
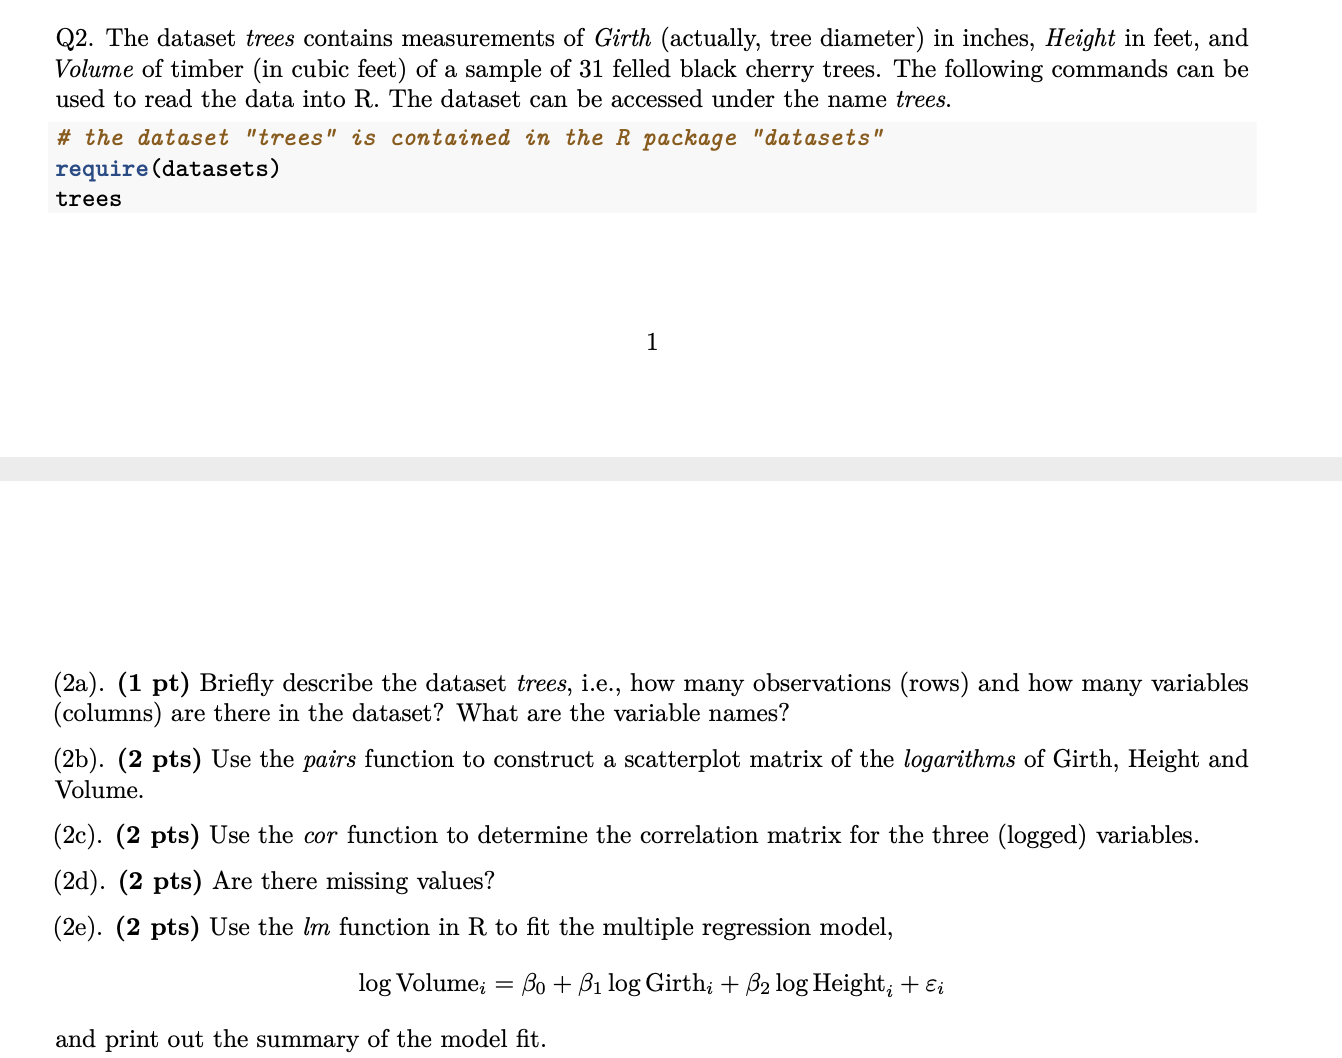
Q2. The dataset trees contains measurements of Girth (actually, tree diameter) in inches, Height in feet, and Volume of timber (in cubic feet) of a sample of 31 felled black cherry trees. The following commands can be used to read the data into R. The dataset can be accessed under the name trees. # the dataset \"trees" is contained in the R package \"datasets\" require(datasets) trees (2a). (1 pt) Briey describe the dataset trees, i.e., how many observations (rows) and how many variables (columns) are there in the dataset? What are the variable names? (2b). (2 pts) Use the pairs function to construct a scatterplot matrix of the logarithms of Girth, Height and Volume. (2c). (2 pts) Use the cor function to determine the correlation matrix for the three (logged) variables. (2d). (2 pts) Are there missing values? (2e). (2 pts) Use the 1m flmction in R to t the multiple regression model, log Volume. = g + l log Girthi, + g log Heighti + 5,; and print out the summary of the model t
Step by Step Solution
There are 3 Steps involved in it

Get step-by-step solutions from verified subject matter experts