

Question: Please help You have put together data on the number of personal computers sold quarterly over the last 7 years (2001-2007). The estimated trend model
Please help
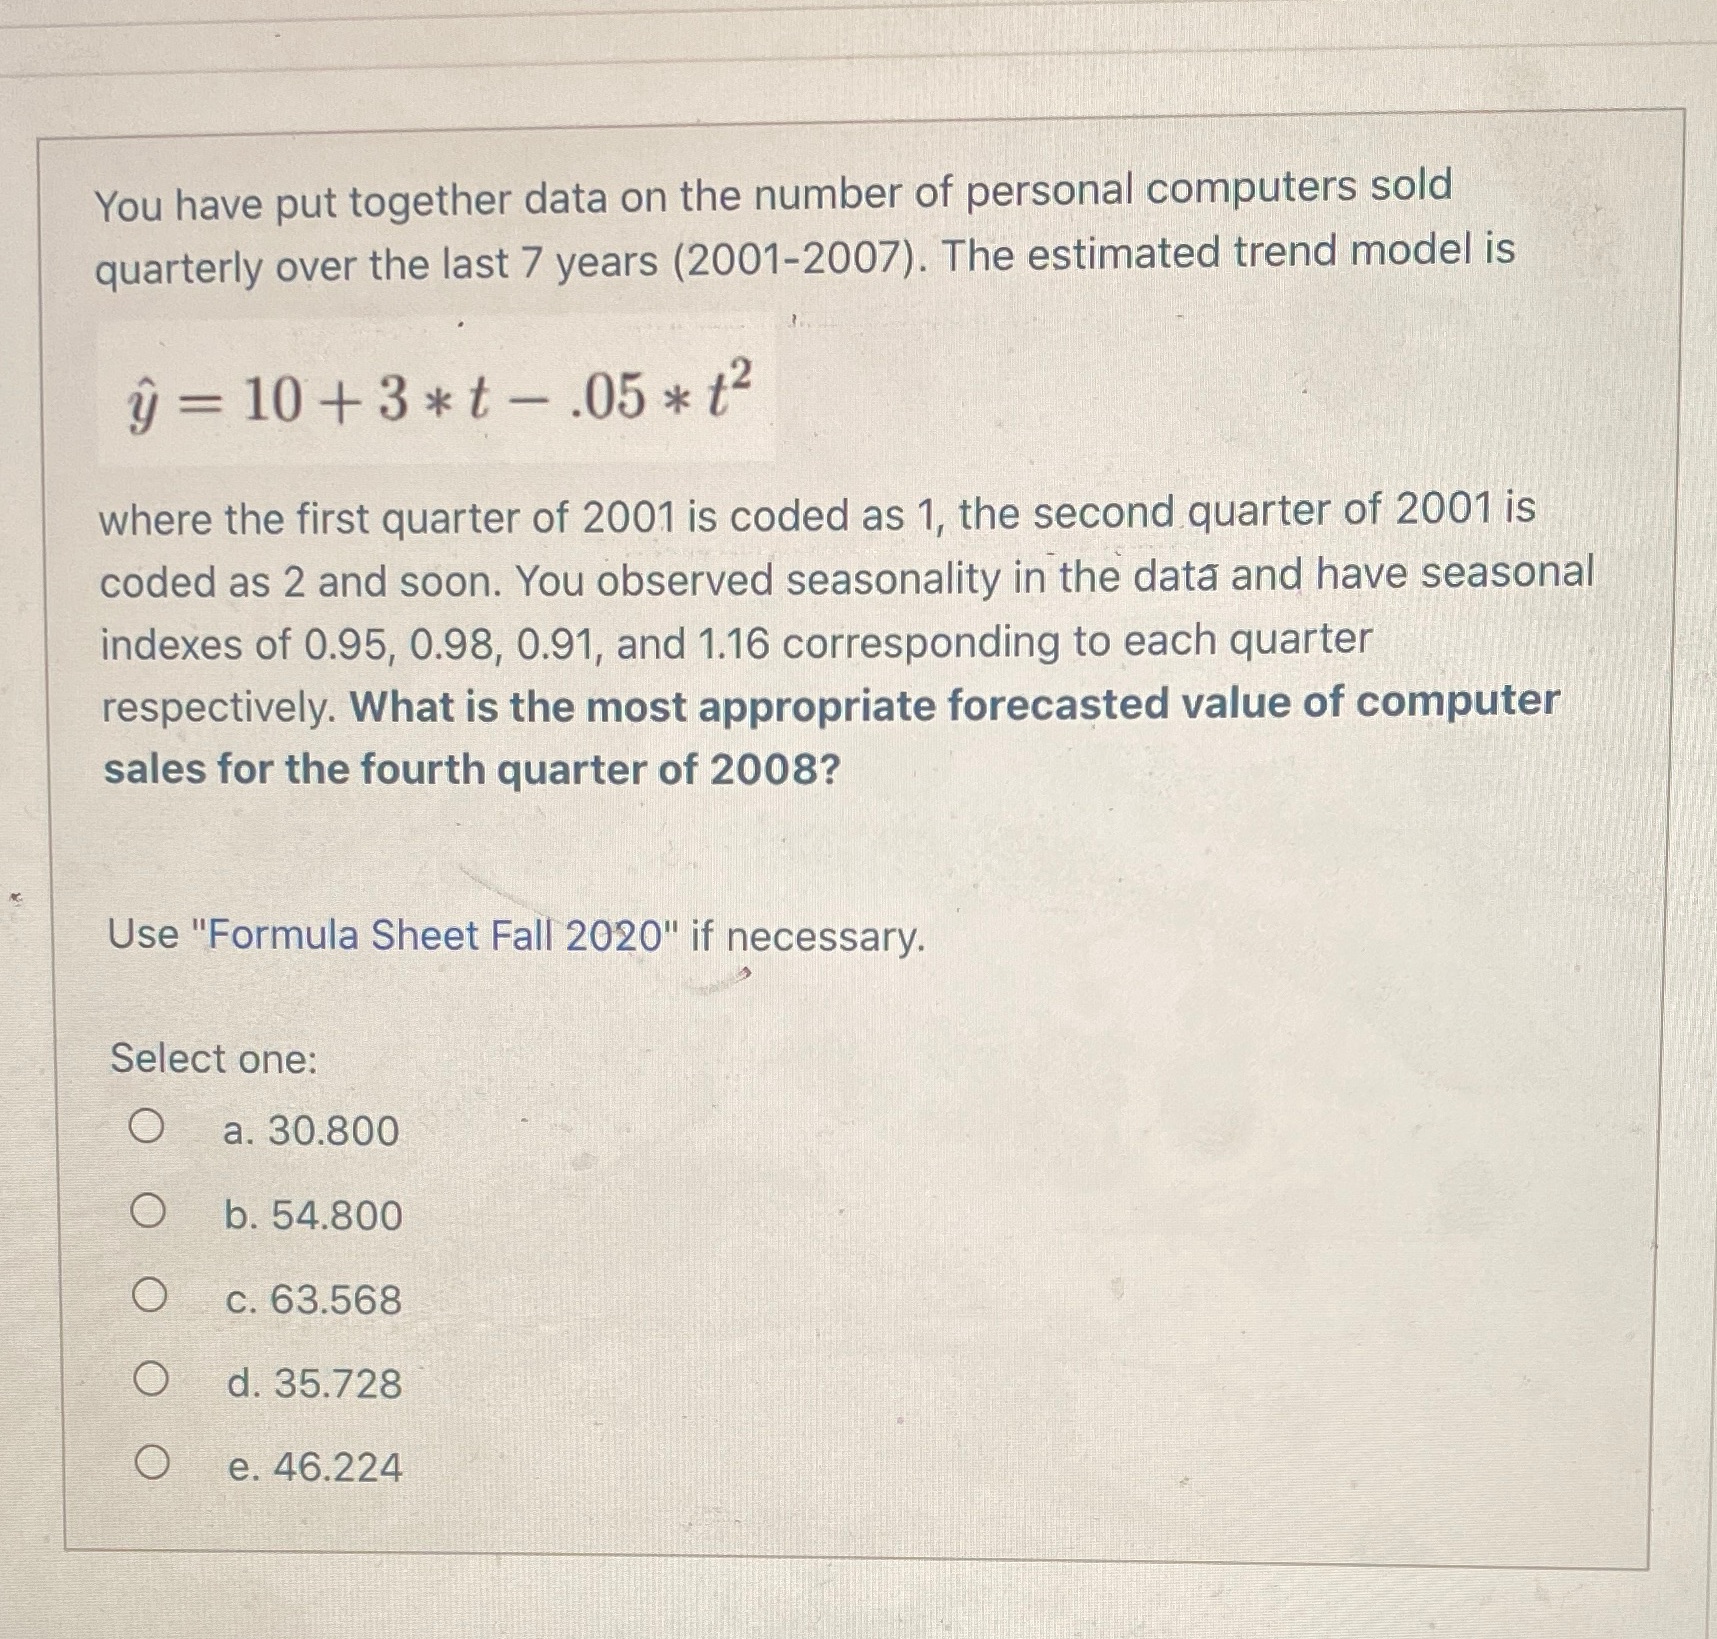
You have put together data on the number of personal computers sold quarterly over the last 7 years (2001-2007). The estimated trend model is y = 10 +3* t -.05 * t2 where the first quarter of 2001 is coded as 1, the second quarter of 2001 is coded as 2 and soon. You observed seasonality in the data and have seasonal indexes of 0.95, 0.98, 0.91, and 1.16 corresponding to each quarter respectively. What is the most appropriate forecasted value of computer sales for the fourth quarter of 2008? Use "Formula Sheet Fall 2020" if necessary. Select one: O a. 30.800 O b. 54.800 O c. 63.568 O d. 35.728 O e. 46.224
Step by Step Solution
There are 3 Steps involved in it
1 Expert Approved Answer
Step: 1 Unlock

Question Has Been Solved by an Expert!
Get step-by-step solutions from verified subject matter experts
Step: 2 Unlock
Step: 3 Unlock