

Question: please helpp asap Question 2 The graph below displays the tension as a function of radius for three different blood vessels. An aneurysm is least
please helpp asap
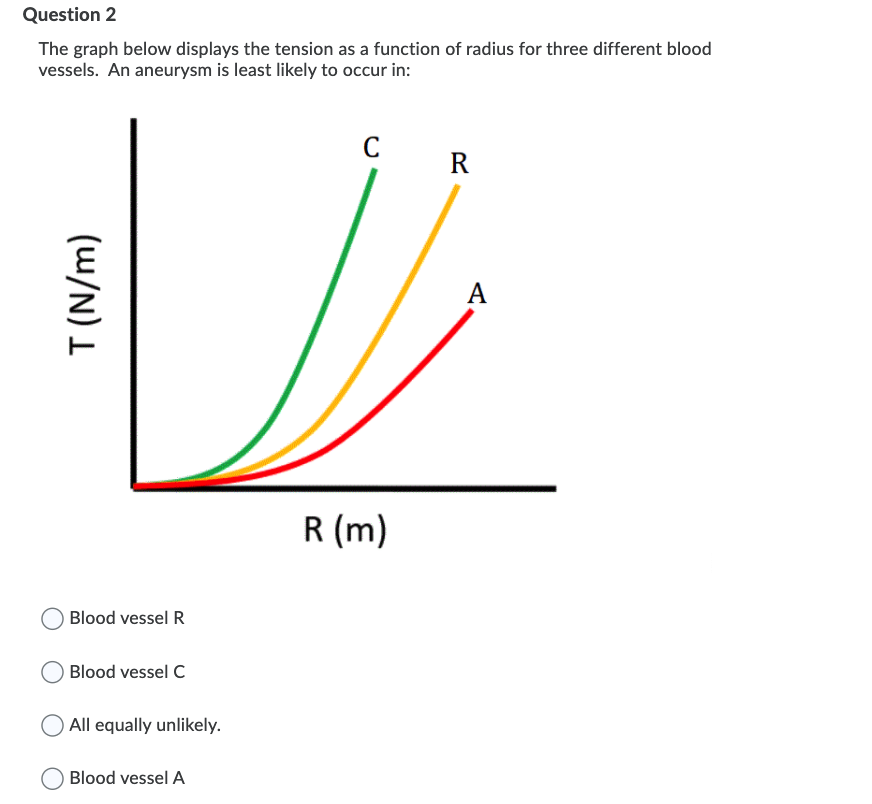
Question 2 The graph below displays the tension as a function of radius for three different blood vessels. An aneurysm is least likely to occur in: T (N/m) 0 Blood vessel R 0 Blood vessel C C) All equally unlikely. 0 Blood vessel A
Step by Step Solution
There are 3 Steps involved in it
1 Expert Approved Answer
Step: 1 Unlock

Question Has Been Solved by an Expert!
Get step-by-step solutions from verified subject matter experts
Step: 2 Unlock
Step: 3 Unlock