

Question: Please highlight/bold answer and show work A pizza delivery service wants to track its delivery times. They take 3 samples of 5 deliveries and record
Please highlight/bold answer and show work 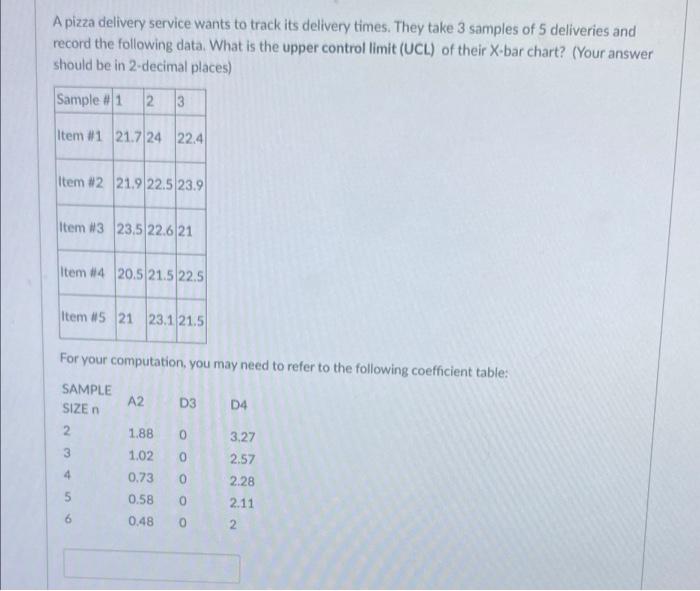
A pizza delivery service wants to track its delivery times. They take 3 samples of 5 deliveries and record the following data. What is the upper controllimit (UCL) of their X-bar chart? (Your answer should be in 2-decimal places) Sample # 1 2 3 Item #1 21.7 24 22.4 Item #2 21.9 22.5 23.9 Item #3 23.5 22.621 Item #4 20.5 21.5 22.5 Item #5 21 23.1 21.5 For your computation, you may need to refer to the following coefficient table: A2 D3 D4 SAMPLE SIZE 2. 3 0 0 1.88 1.02 0.73 0.58 4 3.27 2.57 2.28 2.11 0 0 6 0.48 O N
Step by Step Solution
There are 3 Steps involved in it
1 Expert Approved Answer
Step: 1 Unlock

Question Has Been Solved by an Expert!
Get step-by-step solutions from verified subject matter experts
Step: 2 Unlock
Step: 3 Unlock