

Question: please i need answer The table below shows the summary of the past six months monthly sales. June January February May March April MONTH SALES
please i need answer
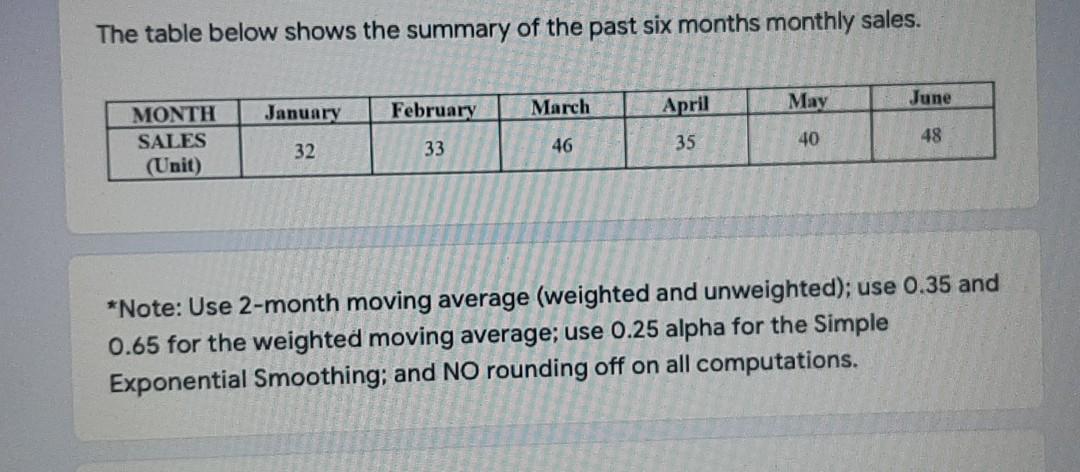
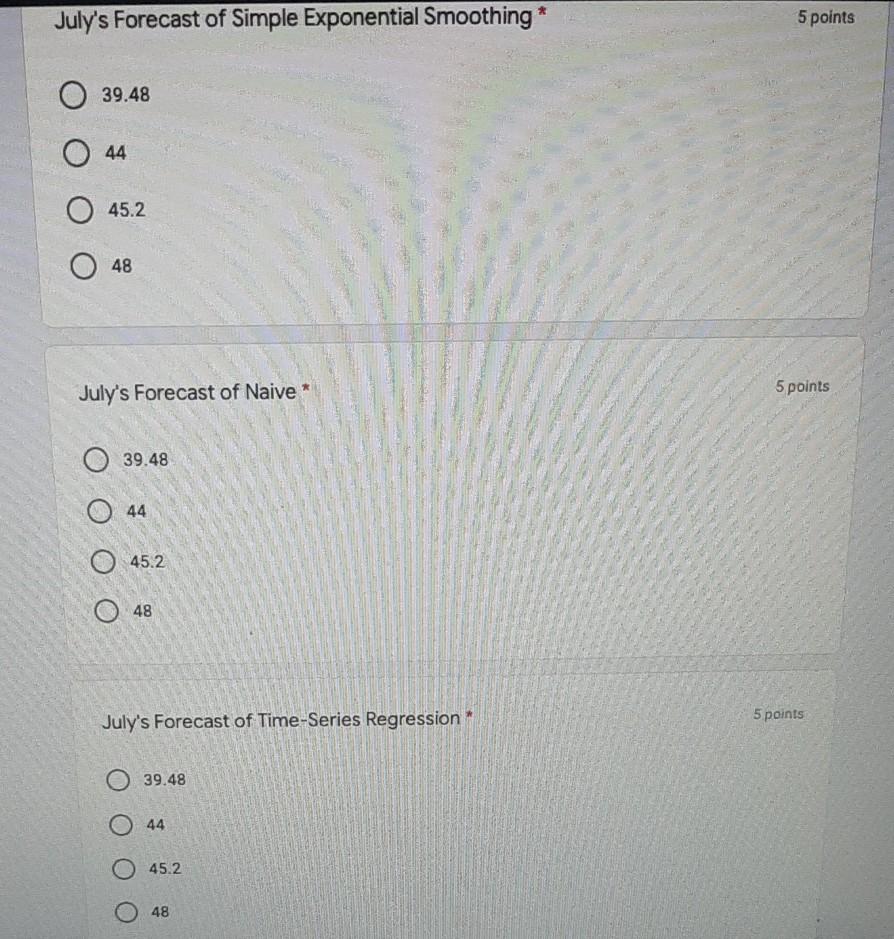
The table below shows the summary of the past six months monthly sales. June January February May March April MONTH SALES (Unit) 32 48 40 33 46 35 *Note: Use 2-month moving average (weighted and unweighted); use 0.35 and 0.65 for the weighted moving average; use 0.25 alpha for the Simple Exponential Smoothing; and NO rounding off on all computations. July's Forecast of Simple Exponential Smoothing * 5 points O 39.48 044 O 45.2 48 July's Forecast of Naive * 5 points 39.48 O 44 45.2 48 July's Forecast of Time-Series Regression 5 points 39.48 O 44 O 45.2 48
Step by Step Solution
There are 3 Steps involved in it
1 Expert Approved Answer
Step: 1 Unlock

Question Has Been Solved by an Expert!
Get step-by-step solutions from verified subject matter experts
Step: 2 Unlock
Step: 3 Unlock