

Question: Please I need excel work 1. Determine a sale value for the property in year 5 based on the appropriate terminal cap rate from Exhibit
Please I need excel work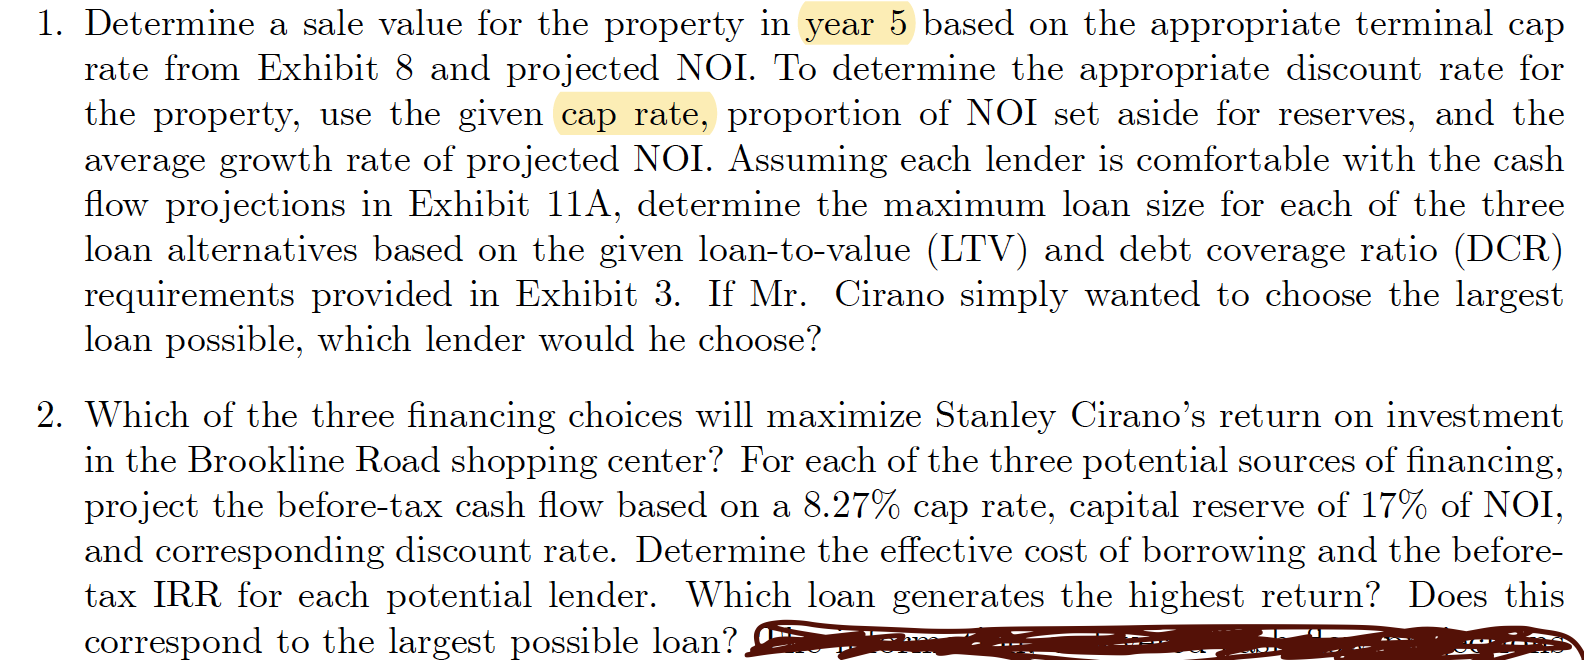
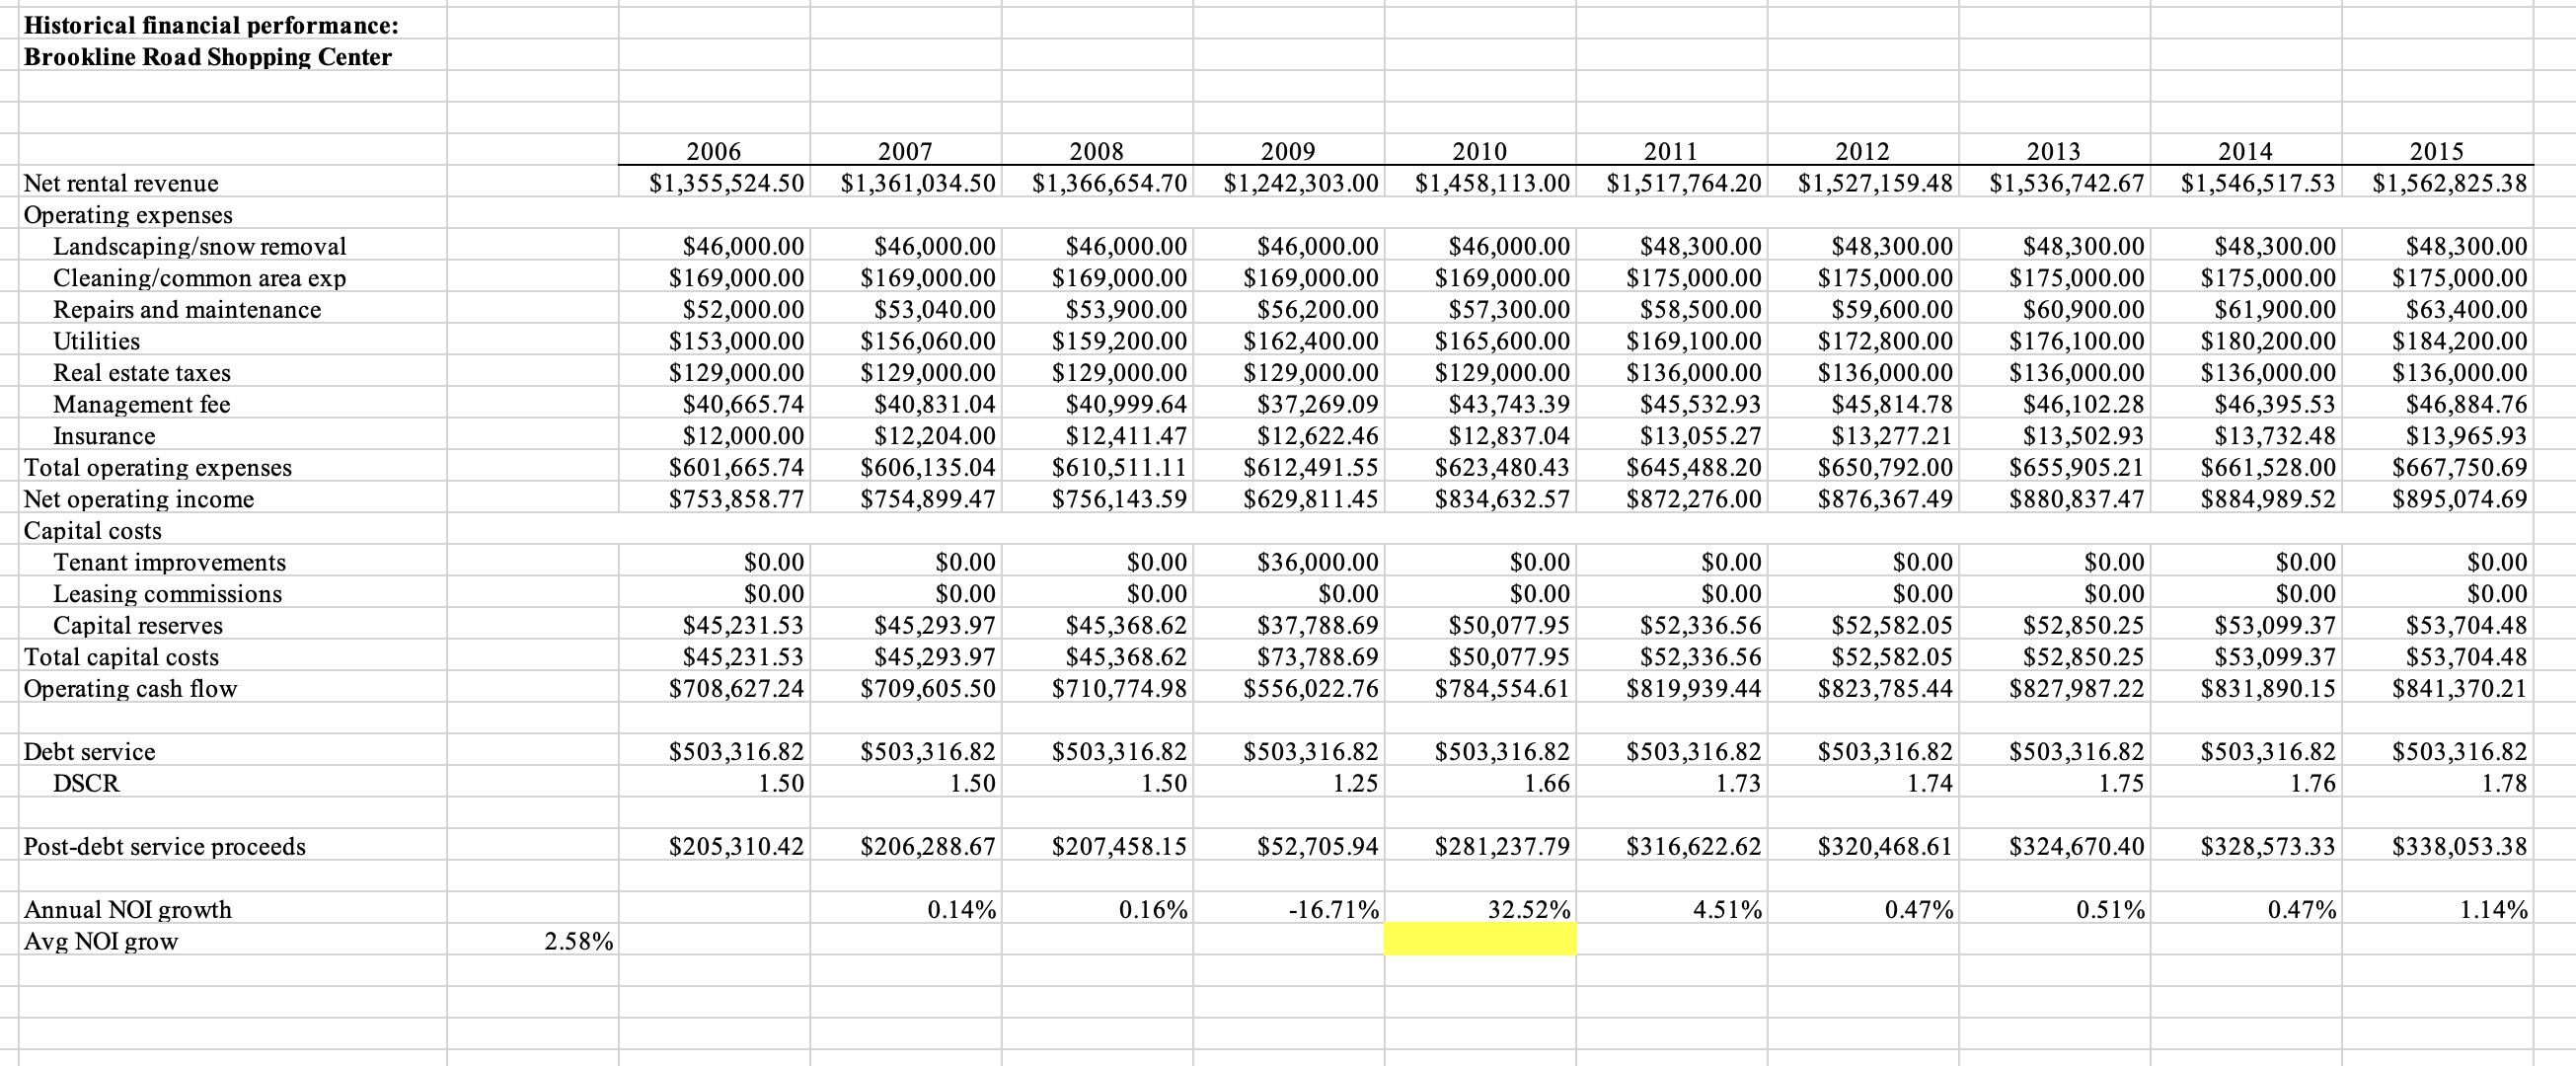
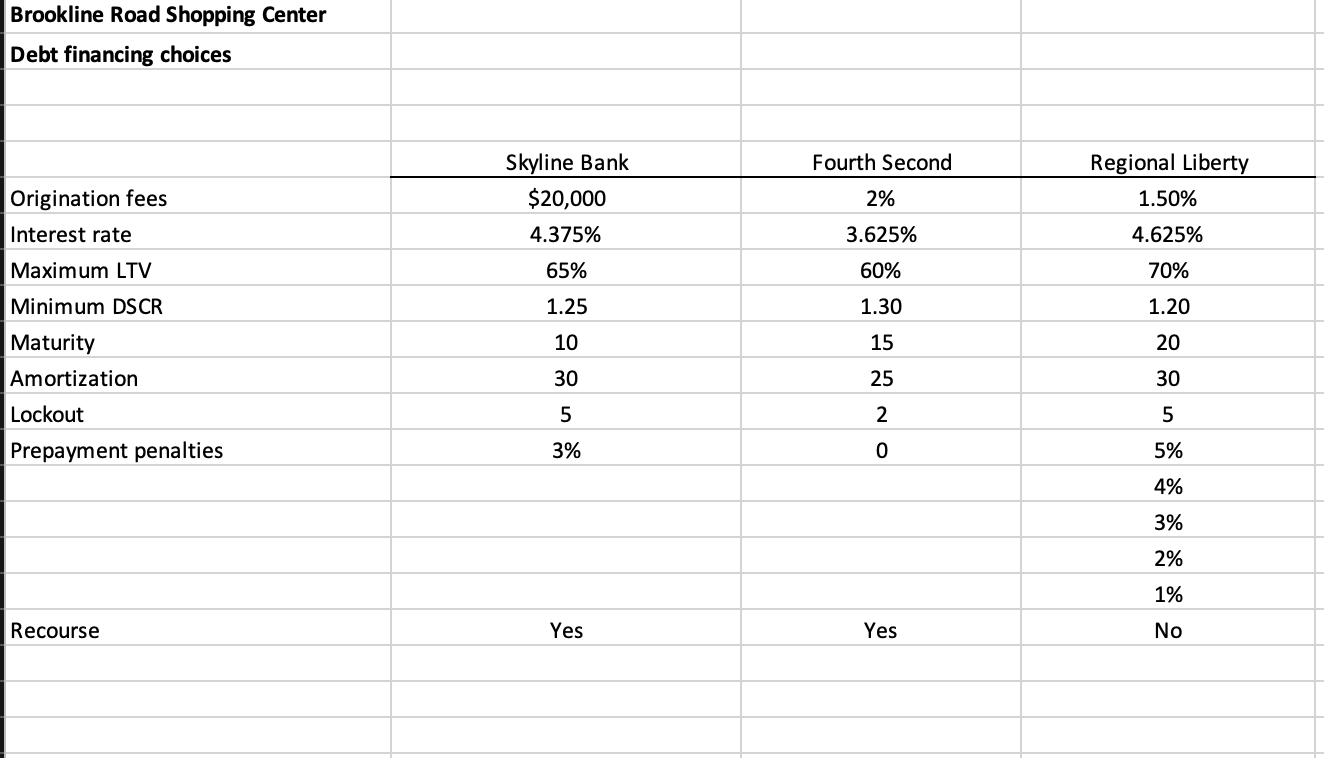
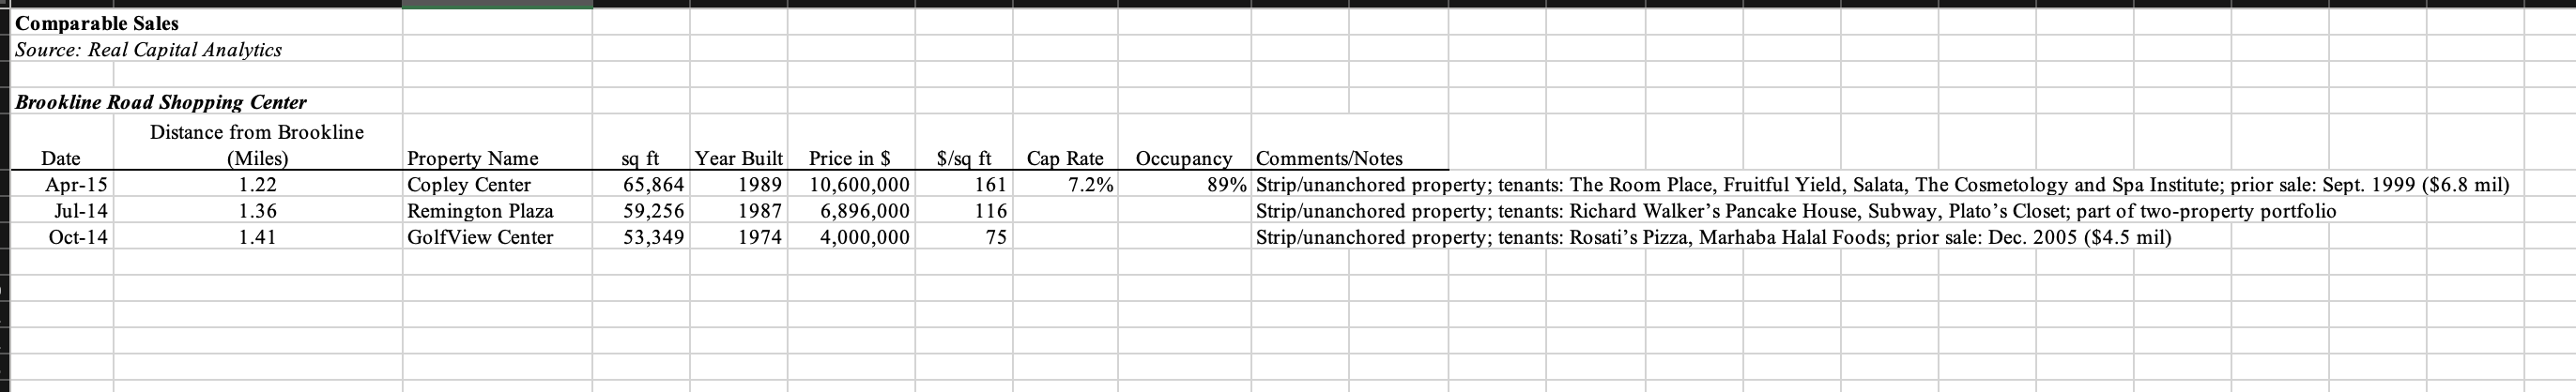
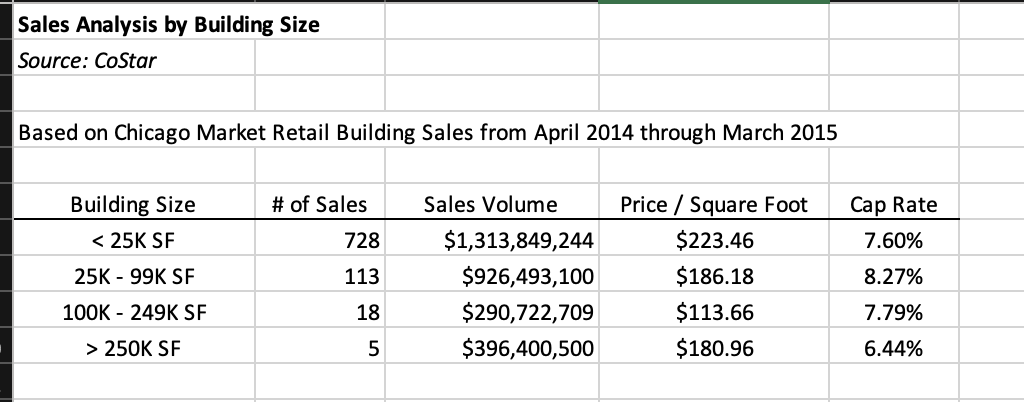
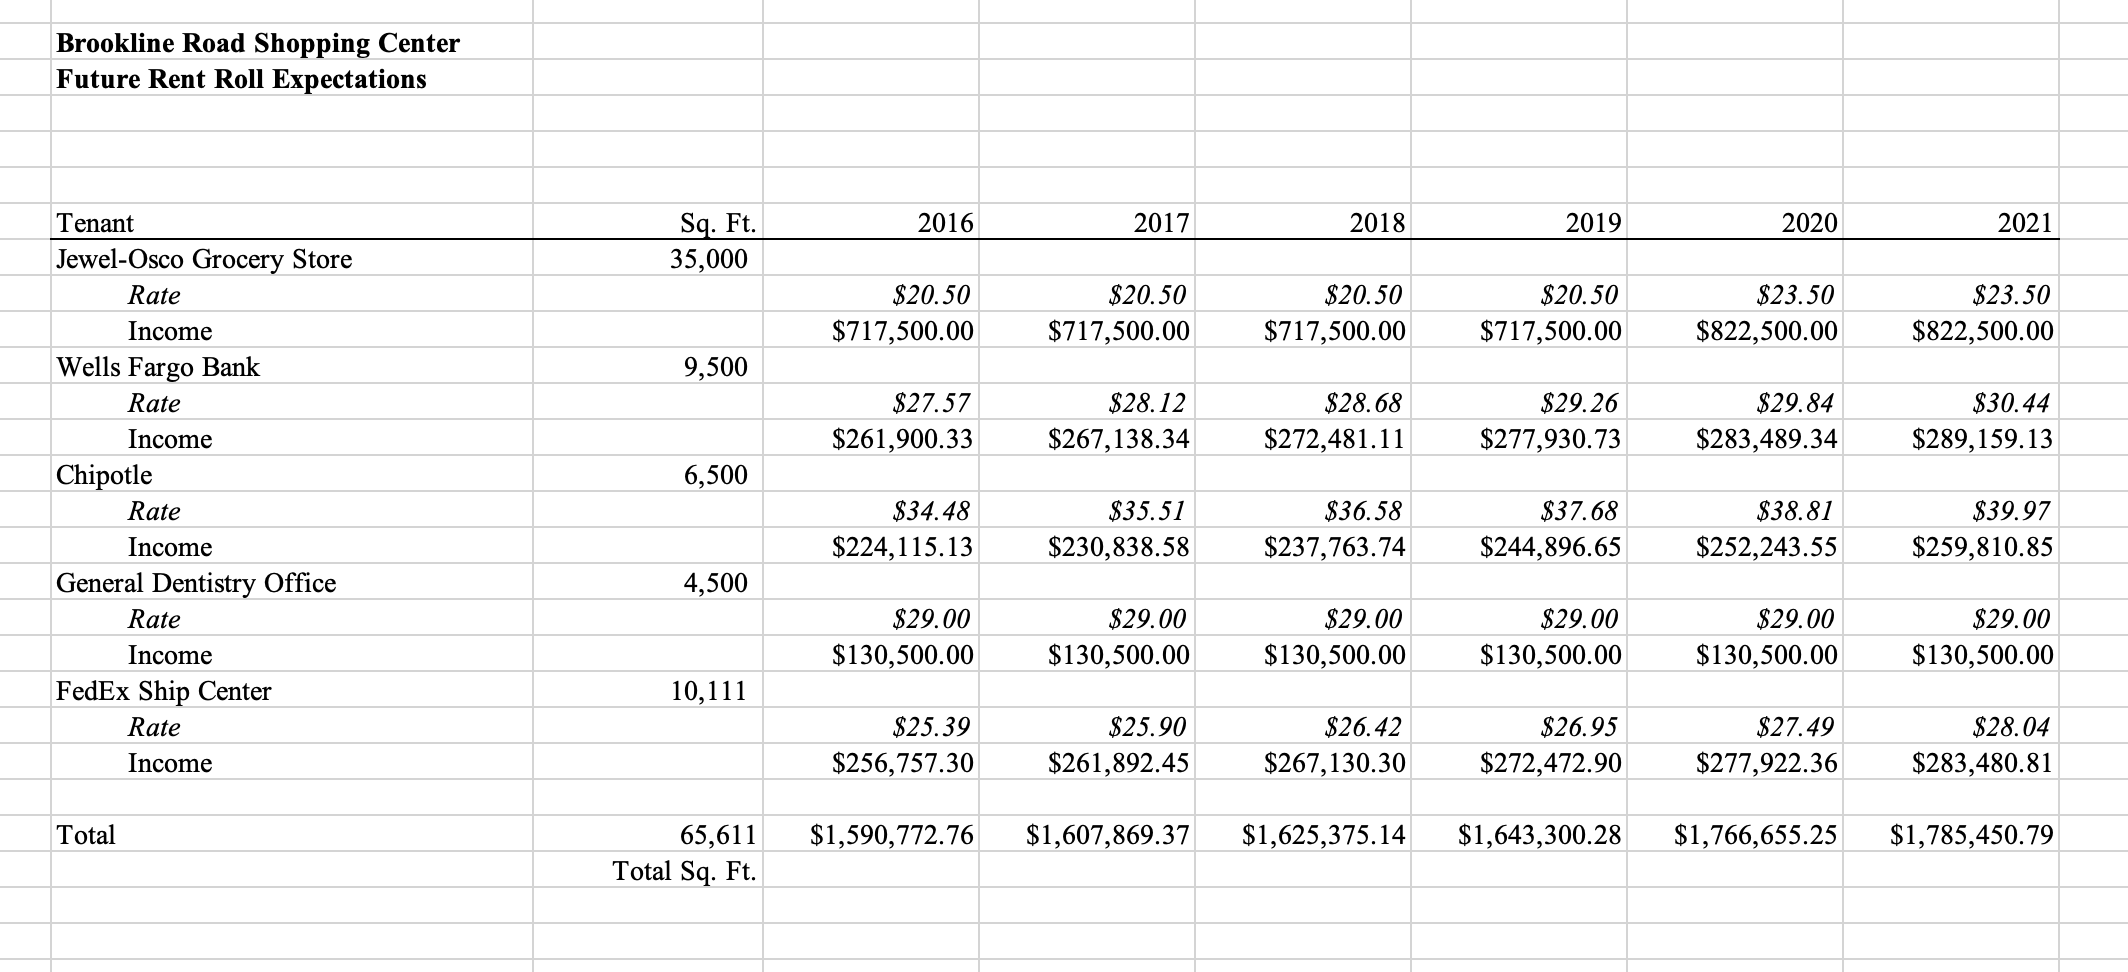
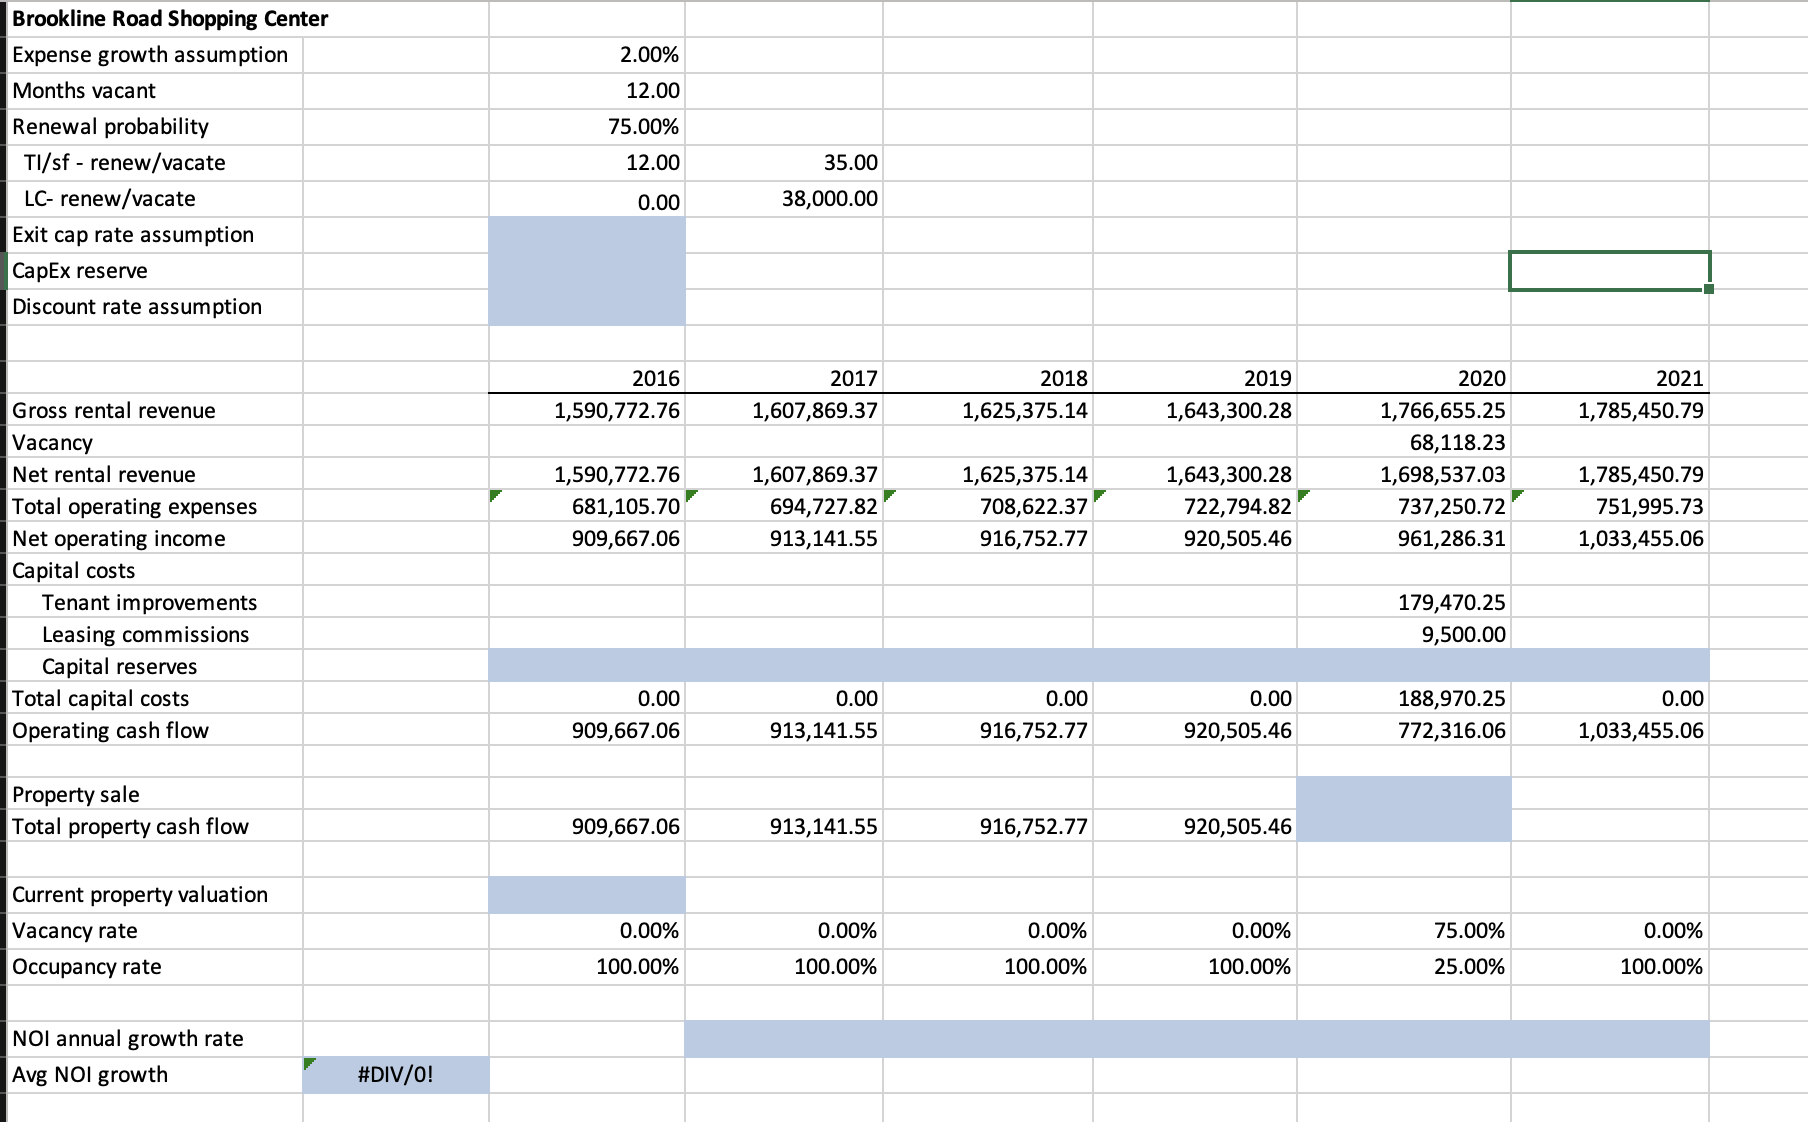
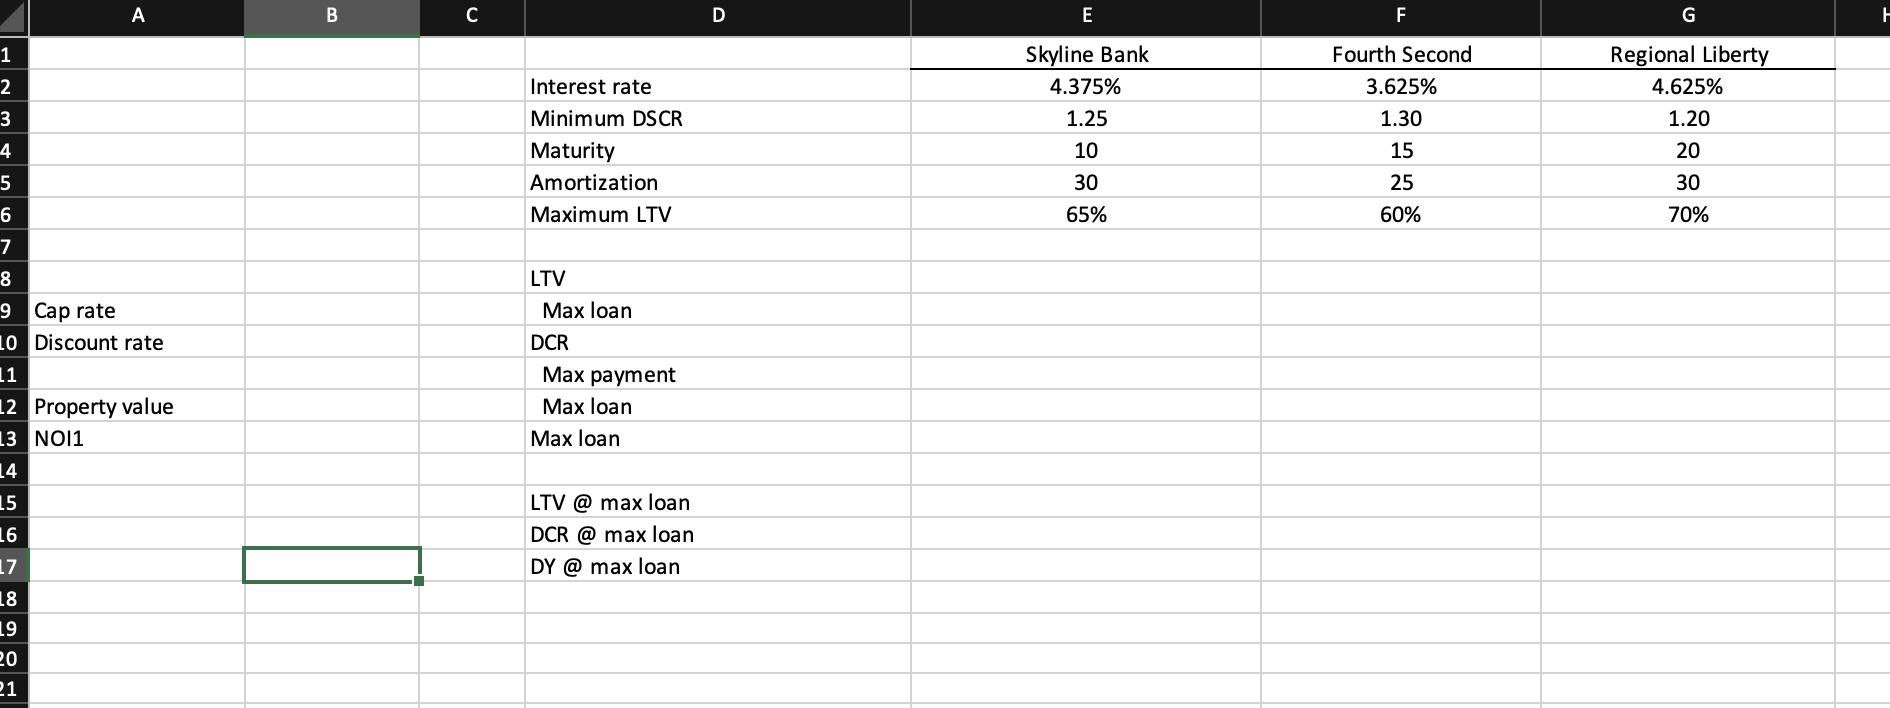
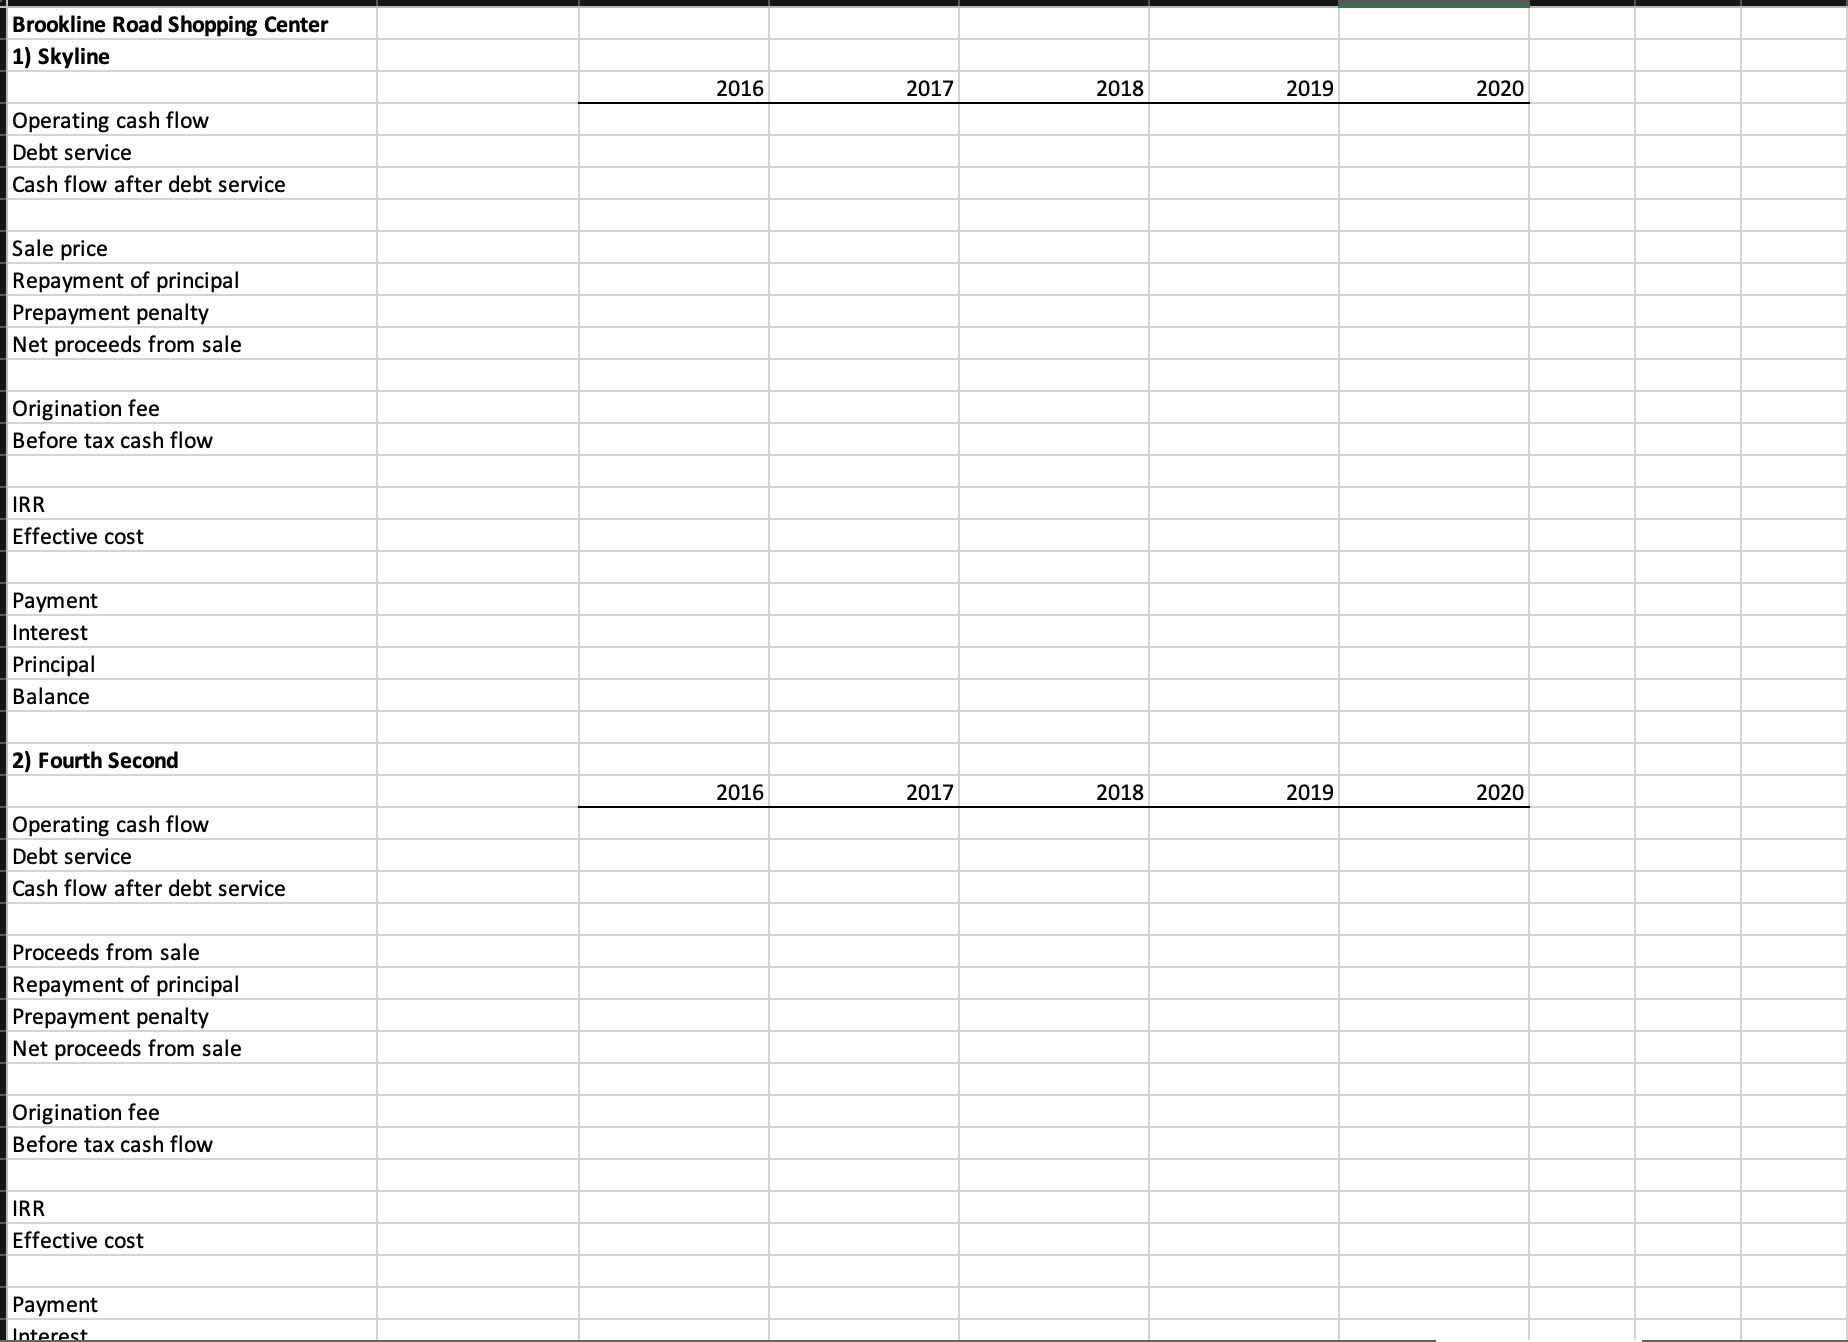
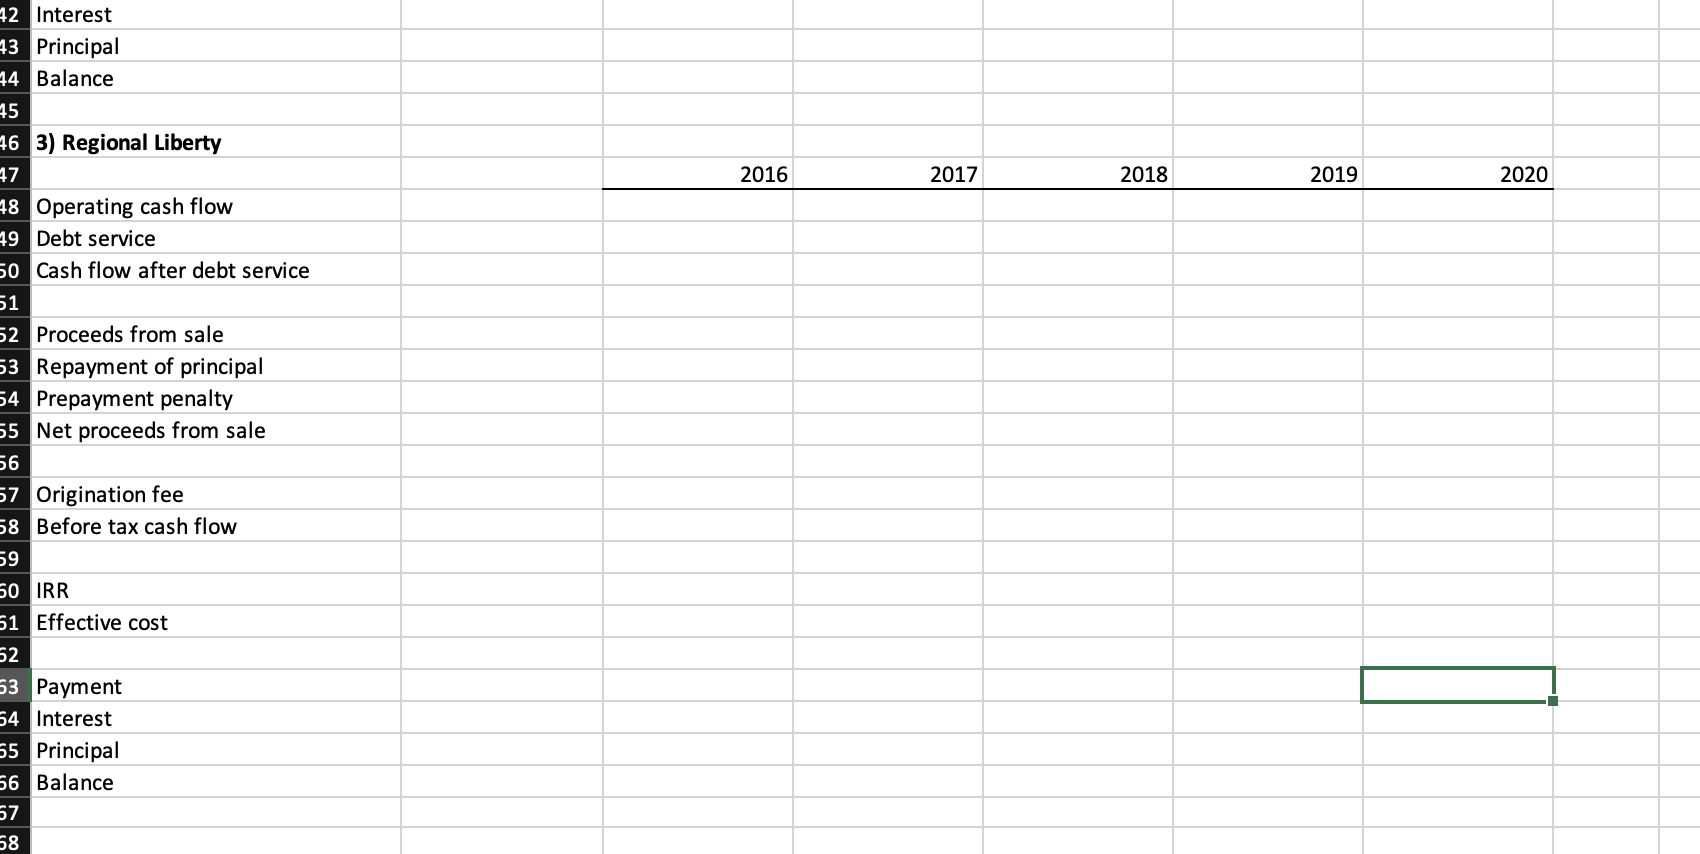
1. Determine a sale value for the property in year 5 based on the appropriate terminal cap rate from Exhibit 8 and projected NOI. To determine the appropriate discount rate for the property, use the given cap rate, proportion of NOI set aside for reserves, and the average growth rate of projected NOI. Assuming each lender is comfortable with the cash flow projections in Exhibit 11A, determine the maximum loan size for each of the three loan alternatives based on the given loan-to-value (LTV) and debt coverage ratio (DCR) requirements provided in Exhibit 3. If Mr. Cirano simply wanted to choose the largest loan possible, which lender would he choose? 2. Which of the three financing choices will maximize Stanley Cirano's return on investment in the Brookline Road shopping center? For each of the three potential sources of financing, project the before-tax cash flow based on a 8.27% cap rate, capital reserve of 17% of NOI, and corresponding discount rate. Determine the effective cost of borrowing and the beforetax IRR for each potential lender. Which loan generates the highest return? Does this Brookline Road Shopping Center 1) Skyline Operating cash flow Debt service Cash flow after debt service Sale price Repayment of principal Prepayment penalty Net proceeds from sale Origination fee Before tax cash flow IRR Effective cost Payment Interest Principal Balance 2) Fourth Second Operating cash flow Debt service Cash flow after debt service Proceeds from sale Repayment of principal Prepayment penalty Net proceeds from sale Origination fee Before tax cash flow IRR Effective cost Payment \begin{tabular}{|c|c|c|c|c|} \hline 2016 & 2017 & 2018 & 2019 & 2020 \\ \hline & & & & \\ \hline & & & & \\ \hline & & & & \\ \hline & & & & \\ \hline & & & & \\ \hline & & & & \\ \hline & & & & \\ \hline & & & & \\ \hline & & & & \\ \hline & & & & \\ \hline & & & & \\ \hline & & & & \\ \hline & & & & \\ \hline & & & & \\ \hline & & & & \\ \hline & & & & \\ \hline & & & & \\ \hline & & & & \\ \hline & & & & \\ \hline & & & & \\ \hline & & & & \\ \hline 2016 & 2017 & 2018 & 2019 & 2020 \\ \hline & & & & \\ \hline & & & & \\ \hline & & & & \\ \hline & & & & \\ \hline & & & & \\ \hline & & & & \\ \hline & & & & \\ \hline & & & & \\ \hline & & & & \\ \hline & & & & \\ \hline & & & & \\ \hline & & & & \\ \hline & & & & \\ \hline & & & & \\ \hline & & & & \\ \hline & & & & \\ \hline \end{tabular} 42 Interest Principal Balance 3) Regional Liberty 8 Operating cash flow Debt service Cash flow after debt service Proceeds from sale Repayment of principal Prepayment penalty Net proceeds from sale Origination fee Before tax cash flow IRR Effective cost Payment Interest Principal Balance \begin{tabular}{|r|r|} \hline & \\ \hline & \\ \hline & \\ \hline 2016 & 2017 \\ \hline \end{tabular} \begin{tabular}{|r|r|r|} \hline & & \\ \hline & & \\ \hline & & \\ \hline \end{tabular} \begin{tabular}{|l|l|l|} \hline & \\ \hline & \\ \hline & \\ \hline & \\ \hline & \\ \hline & \\ \hline & \\ \hline & \\ \hline & \\ \hline \end{tabular} Sales Analysis by Building Size Source: CoStar Based on Chicago Market Retail Building Sales from April 2014 through March 2015 \begin{tabular}{|c|r|r|c|c|} \hline Building Size & \# of Sales & Sales Volume & Price / Square Foot & Cap Rate \\ \hline250K SF & 5 & $396,400,500 & $180.96 & 6.44% \\ \hline \end{tabular} 1. Determine a sale value for the property in year 5 based on the appropriate terminal cap rate from Exhibit 8 and projected NOI. To determine the appropriate discount rate for the property, use the given cap rate, proportion of NOI set aside for reserves, and the average growth rate of projected NOI. Assuming each lender is comfortable with the cash flow projections in Exhibit 11A, determine the maximum loan size for each of the three loan alternatives based on the given loan-to-value (LTV) and debt coverage ratio (DCR) requirements provided in Exhibit 3. If Mr. Cirano simply wanted to choose the largest loan possible, which lender would he choose? 2. Which of the three financing choices will maximize Stanley Cirano's return on investment in the Brookline Road shopping center? For each of the three potential sources of financing, project the before-tax cash flow based on a 8.27% cap rate, capital reserve of 17% of NOI, and corresponding discount rate. Determine the effective cost of borrowing and the beforetax IRR for each potential lender. Which loan generates the highest return? Does this Brookline Road Shopping Center 1) Skyline Operating cash flow Debt service Cash flow after debt service Sale price Repayment of principal Prepayment penalty Net proceeds from sale Origination fee Before tax cash flow IRR Effective cost Payment Interest Principal Balance 2) Fourth Second Operating cash flow Debt service Cash flow after debt service Proceeds from sale Repayment of principal Prepayment penalty Net proceeds from sale Origination fee Before tax cash flow IRR Effective cost Payment \begin{tabular}{|c|c|c|c|c|} \hline 2016 & 2017 & 2018 & 2019 & 2020 \\ \hline & & & & \\ \hline & & & & \\ \hline & & & & \\ \hline & & & & \\ \hline & & & & \\ \hline & & & & \\ \hline & & & & \\ \hline & & & & \\ \hline & & & & \\ \hline & & & & \\ \hline & & & & \\ \hline & & & & \\ \hline & & & & \\ \hline & & & & \\ \hline & & & & \\ \hline & & & & \\ \hline & & & & \\ \hline & & & & \\ \hline & & & & \\ \hline & & & & \\ \hline & & & & \\ \hline 2016 & 2017 & 2018 & 2019 & 2020 \\ \hline & & & & \\ \hline & & & & \\ \hline & & & & \\ \hline & & & & \\ \hline & & & & \\ \hline & & & & \\ \hline & & & & \\ \hline & & & & \\ \hline & & & & \\ \hline & & & & \\ \hline & & & & \\ \hline & & & & \\ \hline & & & & \\ \hline & & & & \\ \hline & & & & \\ \hline & & & & \\ \hline \end{tabular} 42 Interest Principal Balance 3) Regional Liberty 8 Operating cash flow Debt service Cash flow after debt service Proceeds from sale Repayment of principal Prepayment penalty Net proceeds from sale Origination fee Before tax cash flow IRR Effective cost Payment Interest Principal Balance \begin{tabular}{|r|r|} \hline & \\ \hline & \\ \hline & \\ \hline 2016 & 2017 \\ \hline \end{tabular} \begin{tabular}{|r|r|r|} \hline & & \\ \hline & & \\ \hline & & \\ \hline \end{tabular} \begin{tabular}{|l|l|l|} \hline & \\ \hline & \\ \hline & \\ \hline & \\ \hline & \\ \hline & \\ \hline & \\ \hline & \\ \hline & \\ \hline \end{tabular} Sales Analysis by Building Size Source: CoStar Based on Chicago Market Retail Building Sales from April 2014 through March 2015 \begin{tabular}{|c|r|r|c|c|} \hline Building Size & \# of Sales & Sales Volume & Price / Square Foot & Cap Rate \\ \hline250K SF & 5 & $396,400,500 & $180.96 & 6.44% \\ \hline \end{tabular}
Step by Step Solution
There are 3 Steps involved in it

Get step-by-step solutions from verified subject matter experts