

Question: Please I need help answering this Problem, thanks in advance; the previous answers were marked incorrect the program I am using. Maybe it can be
Please I need help answering this Problem, thanks in advance; the previous answers were marked incorrect the program I am using. Maybe it can be review by another tutor. So, I can understand why I am doing wrong and get the full concept.
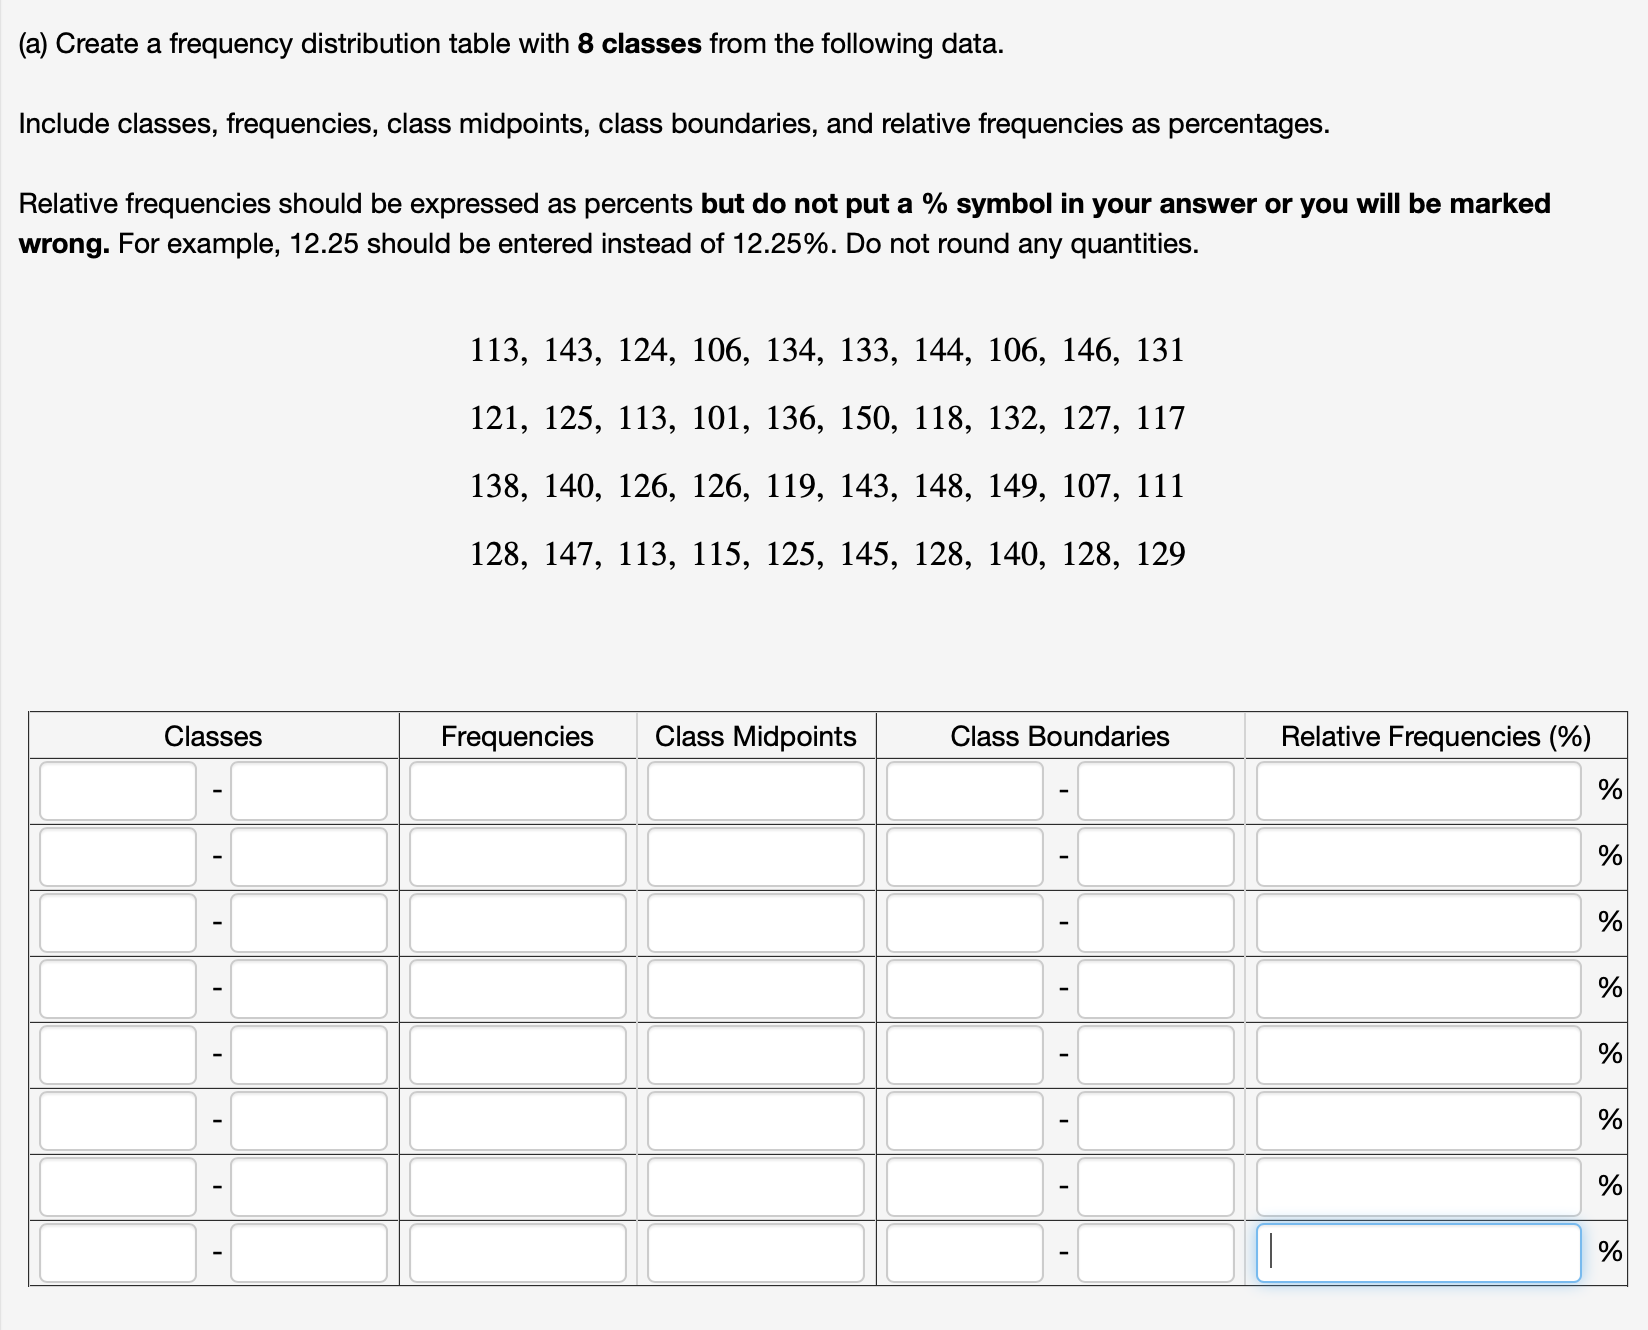
(a) Create a frequency distribution table with 8 classes from the following data. Include classes, frequencies, class midpoints, class boundaries, and relative frequencies as percentages. Relative frequencies should be expressed as percents but do not put a % symbol in your answer or you will be marked wrong. For example, 12.25 should be entered instead of 12.25%. Do not round any quantities. 113, 143, 124, 106, 134, 133, 144, 106, 146, 131 121, 125, 113, 101, 136, 150, 118, 132, 127, 117 138, 140, 126, 126, 119, 143, 148, 149, 107, 111 128, 147, 113, 115, 125, 145, 128, 140, 128, 129 Classes Frequencies Class Midpoints Class Boundaries Relative Frequencies (%) % -(a) Create a frequency distribution table with 8 classes from the following data. Include classes, frequencies, class midpoints, class boundaries, and relative frequencies as percentages. Relative frequencies should be expressed as percents but do not put a % symbol in your answer or you will be marked wrong. For example, 12.25 should be entered instead of 12.25%. Do not round any quantities. 113, 143, 124, 106, 134, 133, 144, 106, 146, 131 121, 125, 113, 101, 136, 150, 118, 132, 127, 117 138, 140, 126, 126, 119, 143, 148, 149, 107, 111 128, 147, 113, 115, 125, 145, 128, 140, 128, 129 Classes Frequencies Class Midpoints Class Boundaries Relative Frequencies (%) %
Step by Step Solution
There are 3 Steps involved in it

Get step-by-step solutions from verified subject matter experts