

Question: please I need help as well as the formulas M Johns Steak House had the following results for January. John, the owner, has asked you
 please I need help as well as the formulas
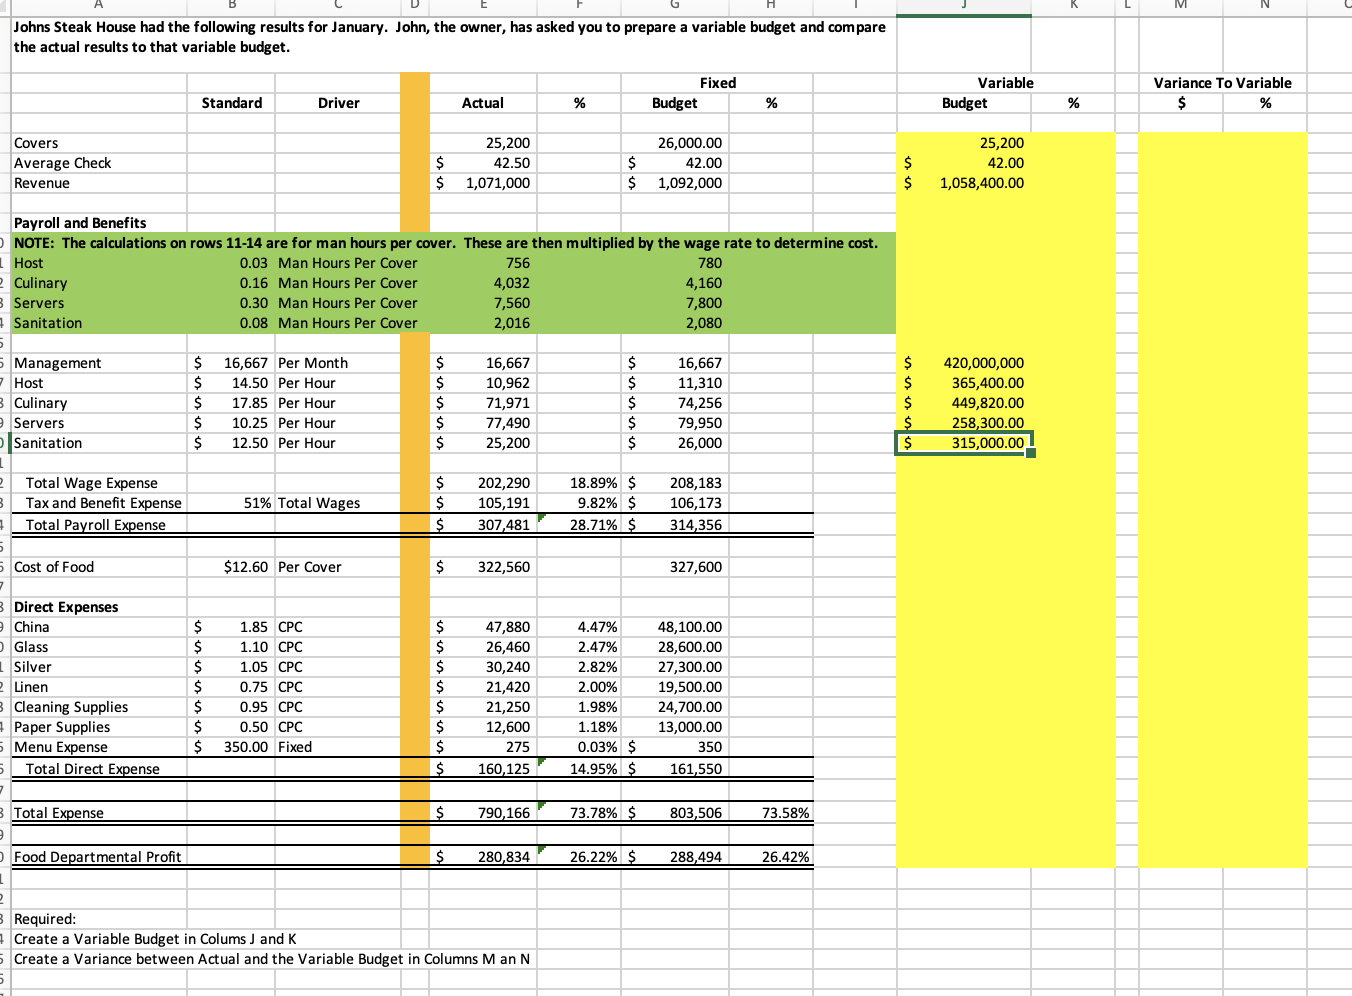
M Johns Steak House had the following results for January. John, the owner, has asked you to prepare a variable budget and compare the actual results to that variable budget. Fixed Budget Variable Budget Variance To Variable $ $ % Standard Driver Actual % % % Covers Average Check Revenue 25,200 $ 42.50 $ 1,071,000 26,000.00 $ 42.00 $ 1,092,000 $ $ 25,200 42.00 1,058,400.00 Payroll and Benefits NOTE: The calculations on rows 11-14 are for man hours per cover. These are then multiplied by the wage rate to determine cost. 1 Host 0.03 Man Hours Per Cover 756 780 2 Culinary 0.16 Man Hours Per Cover 4,032 4,160 B Servers 0.30 Man Hours Per Cover 7,560 7,800 7 Sanitation 0.08 Man Hours Per Cover 2,016 2,080 5 5 Management $ 16,667 Per Month $ 16,667 $ 16,667 - Host $ 14.50 Per Hour $ 10,962 $ 11,310 3 Culinary $ 17.85 Per Hour $ 71,971 $ 74,256 Servers $ 10.25 Per Hour $ 77,490 $ 79,950 Sanitation $ 12.50 Per Hour $ 25,200 $ 26,000 1 2 Total Wage Expense $ 202,290 18.89% $ 208,183 Tax and Benefit Expense 51% Total Wages $ 105,191 9.82% $ 106,173 Total Payroll Expense $ 307,481 28.71% $ 314,356 $ $ $ $ $ $ 420,000,000 365,400.00 449,820.00 258,300.00 315,000.00 5 Cost of Food $12.60 Per Cover $ 322,560 327,600 Direct Expenses China Glass 1 Silver Linen Cleaning Supplies Paper Supplies 5 Menu Expense 5 Total Direct Expense - Total Expense $ $ $ $ $ $ $ $ $ 1.85 CPC 1.10 CPC 1.05 CPC 0.75 CPC 0.95 CPC 0.50 CPC 350.00 Fixed $ $ $ $ $ $ $ $ $ 47,880 26,460 30,240 21,420 21,250 12,600 275 4.47% 2.47% 2.82% 2.00% 1.98% 1.18% 0.03% $ 14.95% $ 48,100.00 28,600.00 27,300.00 19,500.00 24,700.00 13,000.00 350 160,125 161,550 $ 790,166 73.78% $ 803,506 73.58% Food Departmental Profit $ 280,834 26.22% $ 288,494 26.42% 1 2 Required: Create a Variable Budget in Colums J and K Create a Variance between Actual and the Variable Budget in Columns Man N 5 M Johns Steak House had the following results for January. John, the owner, has asked you to prepare a variable budget and compare the actual results to that variable budget. Fixed Budget Variable Budget Variance To Variable $ $ % Standard Driver Actual % % % Covers Average Check Revenue 25,200 $ 42.50 $ 1,071,000 26,000.00 $ 42.00 $ 1,092,000 $ $ 25,200 42.00 1,058,400.00 Payroll and Benefits NOTE: The calculations on rows 11-14 are for man hours per cover. These are then multiplied by the wage rate to determine cost. 1 Host 0.03 Man Hours Per Cover 756 780 2 Culinary 0.16 Man Hours Per Cover 4,032 4,160 B Servers 0.30 Man Hours Per Cover 7,560 7,800 7 Sanitation 0.08 Man Hours Per Cover 2,016 2,080 5 5 Management $ 16,667 Per Month $ 16,667 $ 16,667 - Host $ 14.50 Per Hour $ 10,962 $ 11,310 3 Culinary $ 17.85 Per Hour $ 71,971 $ 74,256 Servers $ 10.25 Per Hour $ 77,490 $ 79,950 Sanitation $ 12.50 Per Hour $ 25,200 $ 26,000 1 2 Total Wage Expense $ 202,290 18.89% $ 208,183 Tax and Benefit Expense 51% Total Wages $ 105,191 9.82% $ 106,173 Total Payroll Expense $ 307,481 28.71% $ 314,356 $ $ $ $ $ $ 420,000,000 365,400.00 449,820.00 258,300.00 315,000.00 5 Cost of Food $12.60 Per Cover $ 322,560 327,600 Direct Expenses China Glass 1 Silver Linen Cleaning Supplies Paper Supplies 5 Menu Expense 5 Total Direct Expense - Total Expense $ $ $ $ $ $ $ $ $ 1.85 CPC 1.10 CPC 1.05 CPC 0.75 CPC 0.95 CPC 0.50 CPC 350.00 Fixed $ $ $ $ $ $ $ $ $ 47,880 26,460 30,240 21,420 21,250 12,600 275 4.47% 2.47% 2.82% 2.00% 1.98% 1.18% 0.03% $ 14.95% $ 48,100.00 28,600.00 27,300.00 19,500.00 24,700.00 13,000.00 350 160,125 161,550 $ 790,166 73.78% $ 803,506 73.58% Food Departmental Profit $ 280,834 26.22% $ 288,494 26.42% 1 2 Required: Create a Variable Budget in Colums J and K Create a Variance between Actual and the Variable Budget in Columns Man N 5
Step by Step Solution
There are 3 Steps involved in it

Get step-by-step solutions from verified subject matter experts