

Question: Please I need help creating the modified-box and whiskers plot for the population also please include the diagram . Thank you The following table lists
Please I need help creating the modified-box and whiskers plot for the population also please include the diagram . Thank you
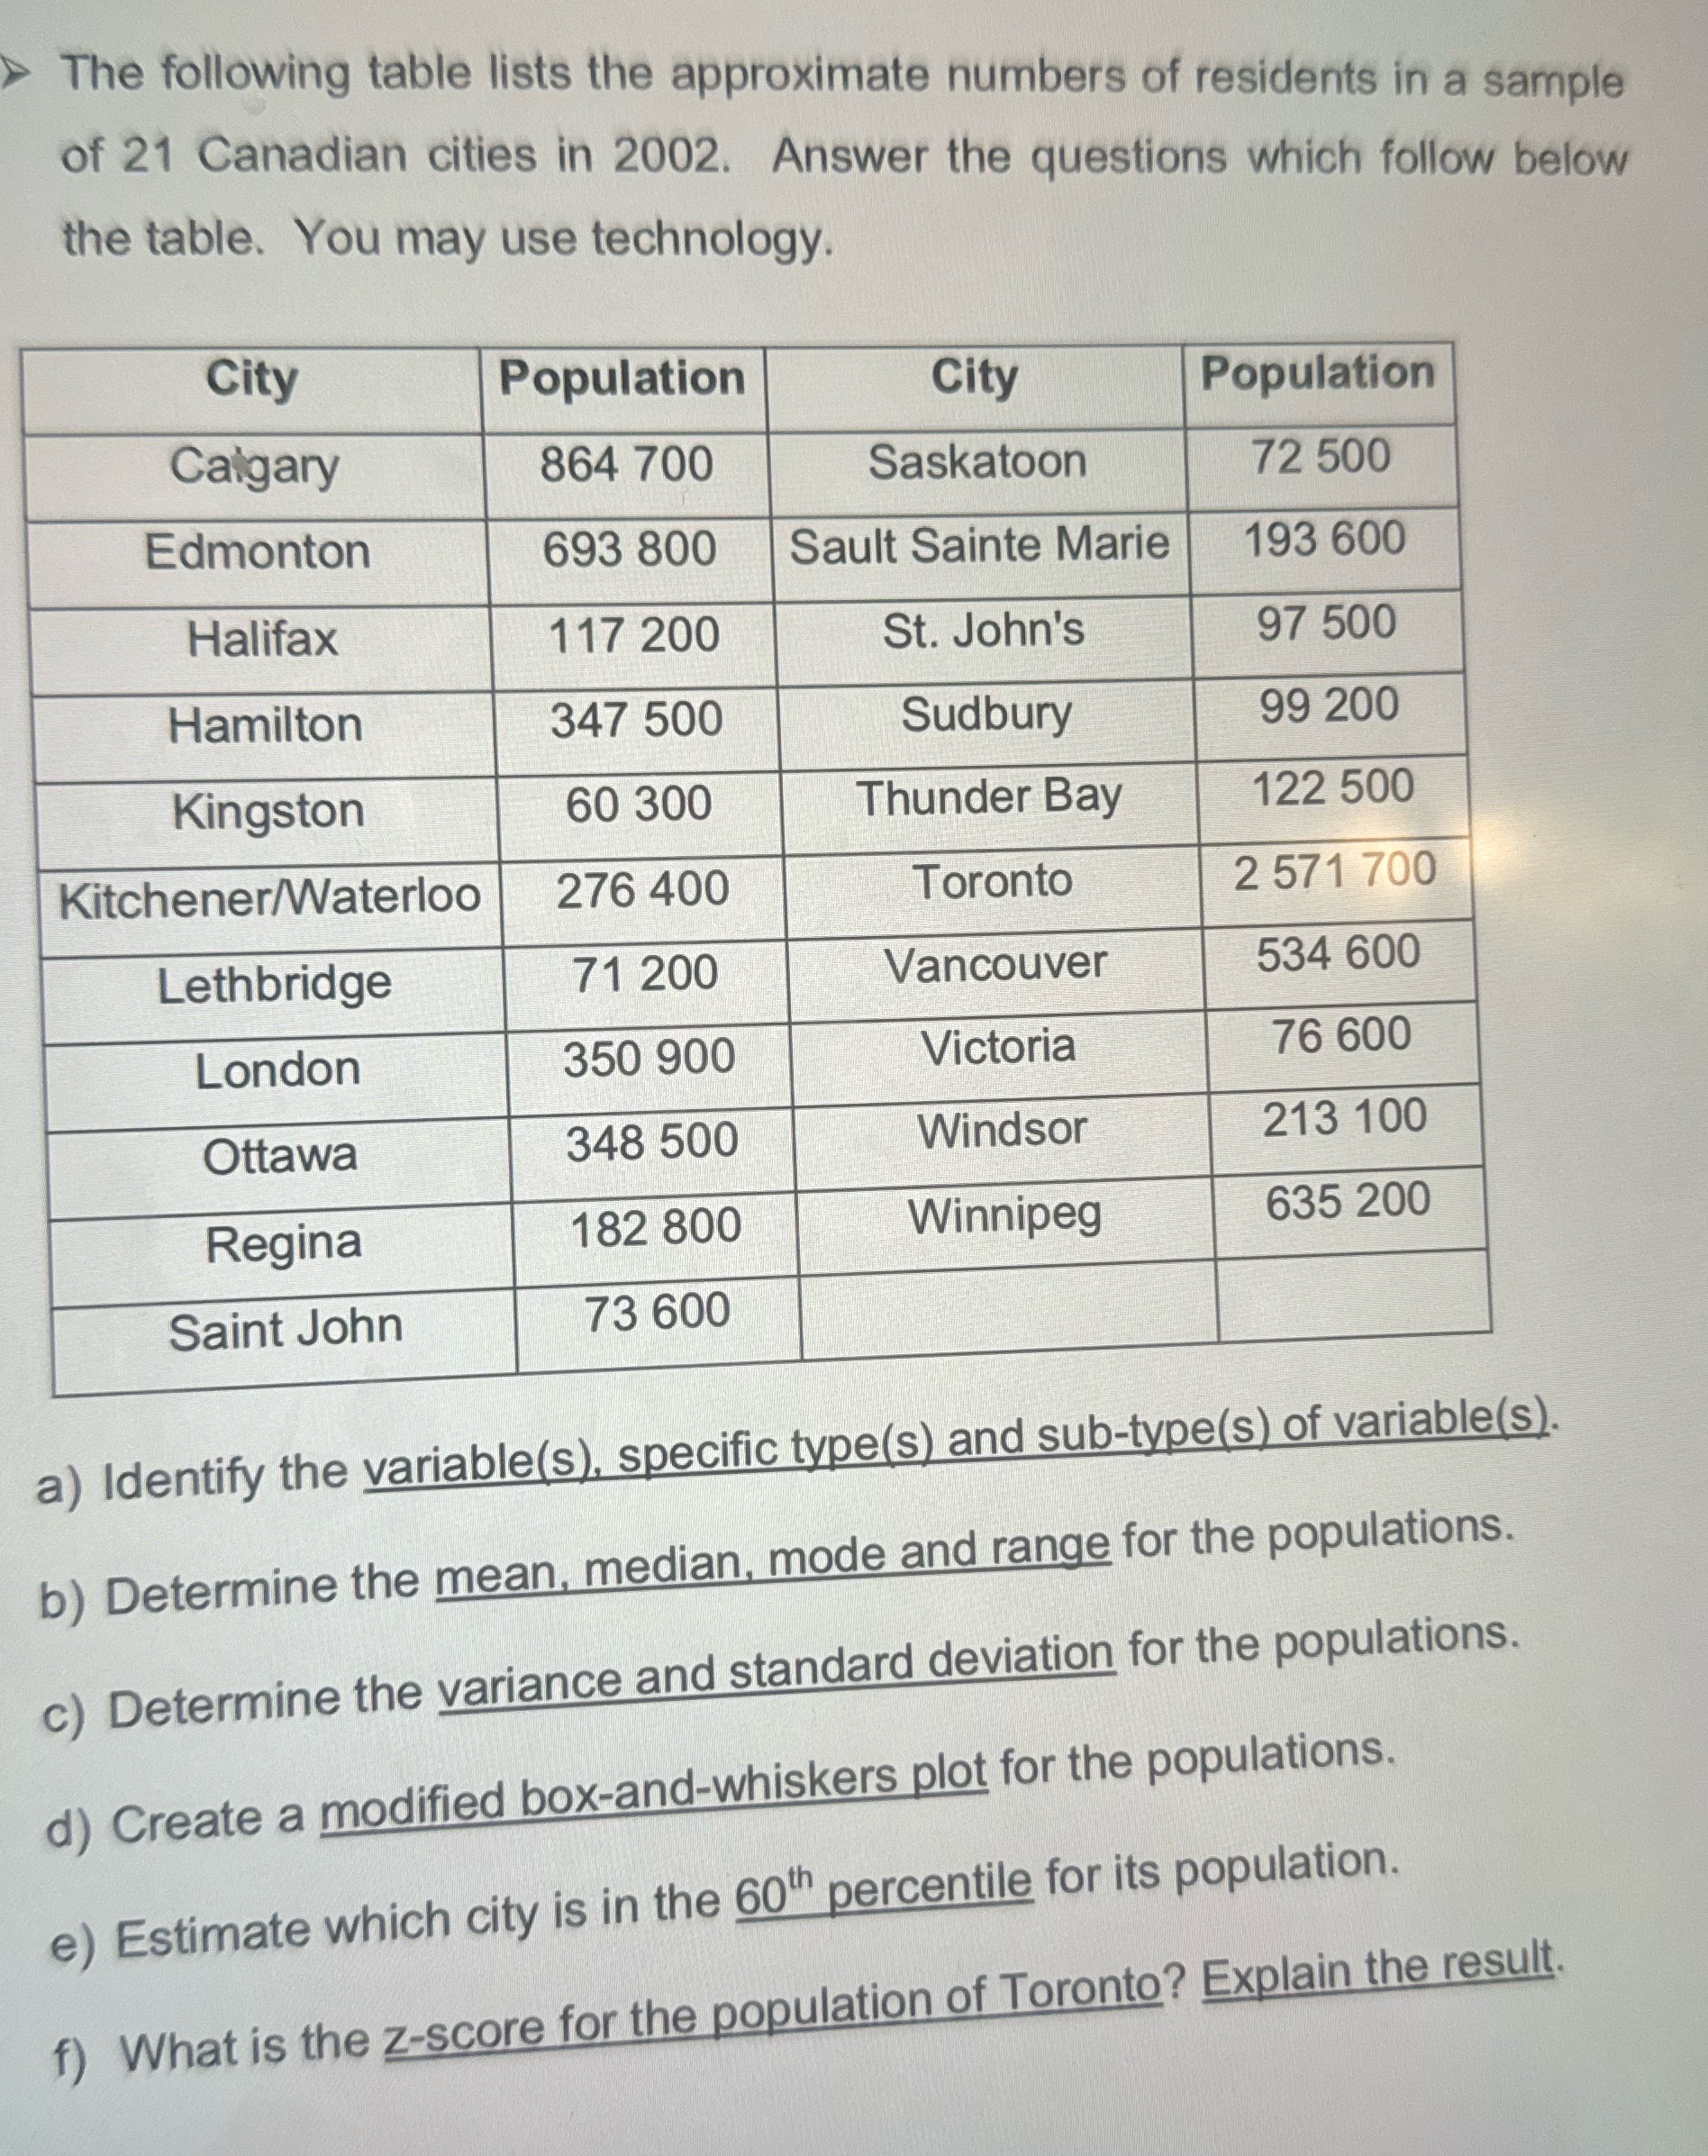
The following table lists the approximate numbers of residents in a sample of 21 Canadian cities in 2002. Answer the questions which follow below the table. You may use technology. City Population City Population Calgary 864 700 Saskatoon 72 500 Edmonton 693 800 Sault Sainte Marie 193 600 Halifax 117 200 St. John's 97 500 Hamilton 347 500 Sudbury 99 200 Kingston 60 300 Thunder Bay 122 500 Kitchener/Waterloo 276 400 Toronto 2 571 700 Lethbridge 71 200 Vancouver 534 600 London 350 900 Victoria 76 600 Ottawa 348 500 Windsor 213 100 Regina 182 800 Winnipeg 635 200 Saint John 73 600 a) Identify the variable(s), specific type(s) and sub-type(s) of variable(s) b) Determine the mean, median, mode and range for the populations. c) Determine the variance and standard deviation for the populations. d) Create a modified box-and-whiskers plot for the populations. e) Estimate which city is in the 60" percentile for its population. f) What is the z-score for the population of Toronto? Explain the result
Step by Step Solution
There are 3 Steps involved in it

Get step-by-step solutions from verified subject matter experts