

Question: Please I need help finding the least squares regression line, Interpreting the slope, Predicting the final exam score for a student who missed five class
Please I need help finding the least squares regression line, Interpreting the slope, Predicting the final exam score for a student who missed five class period, and drawing the least squares regression line.
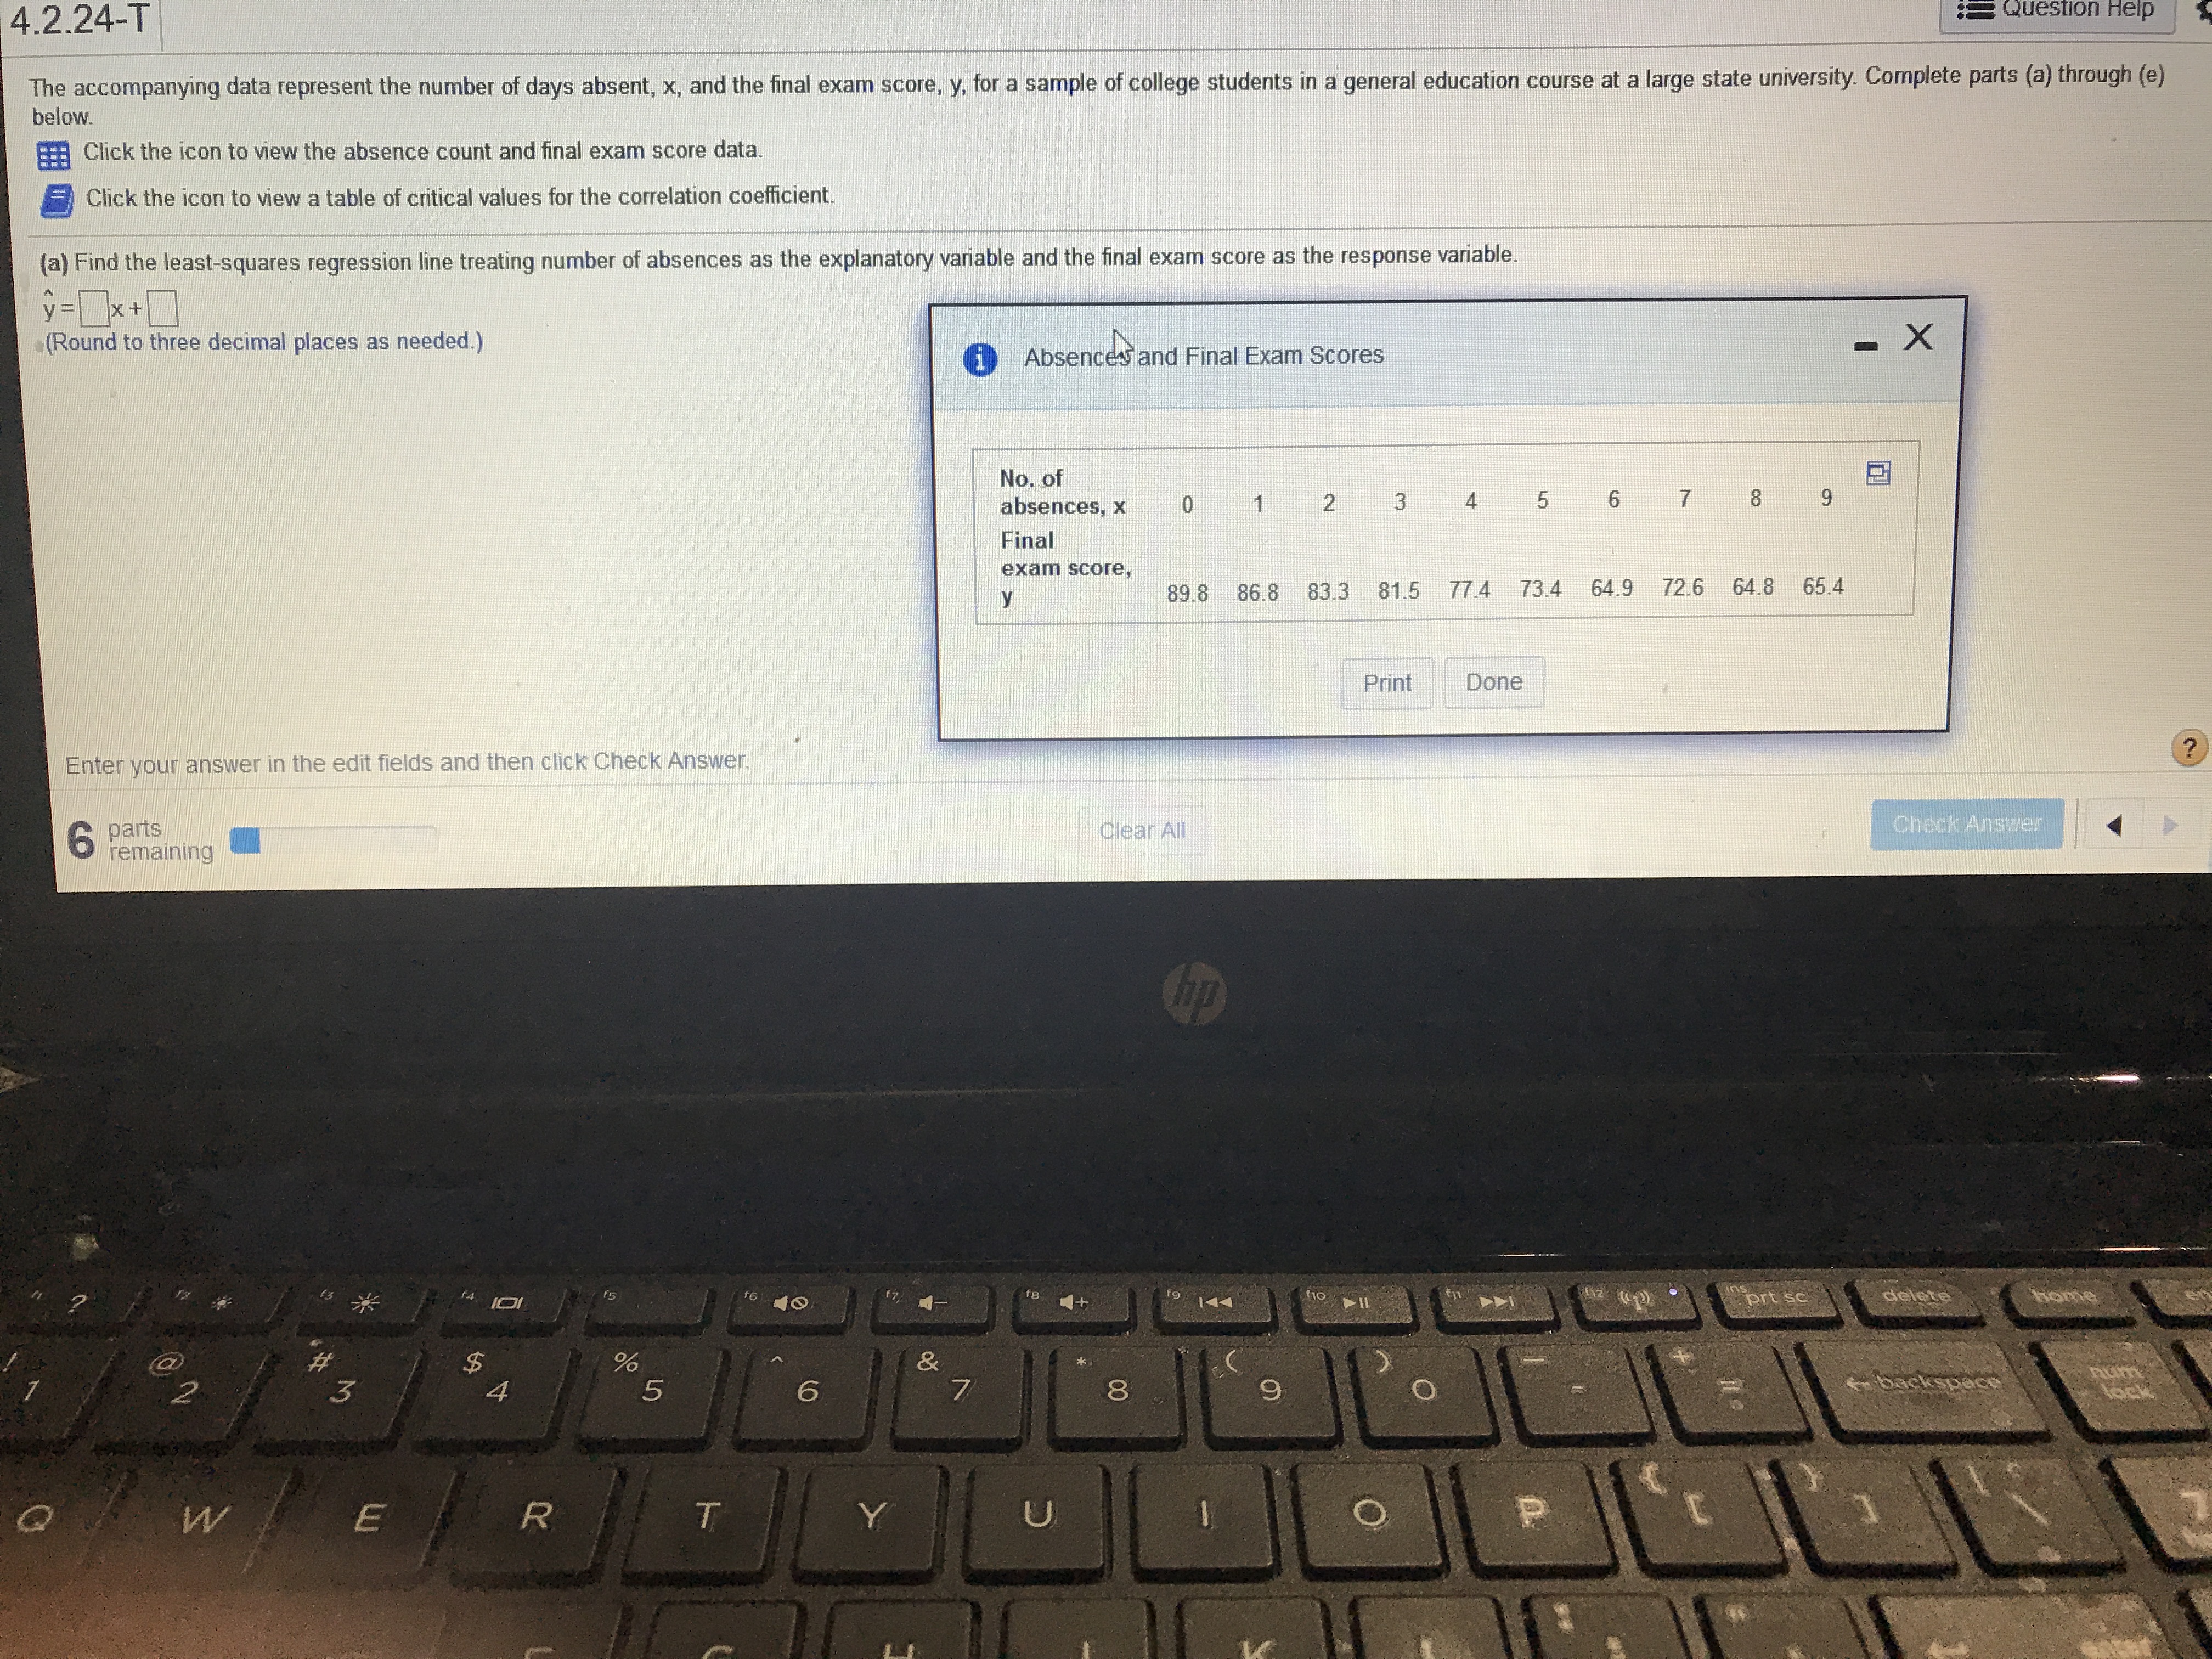
4.2.24-T Jestion Help The accompanying data represent the number of days absent, x, and the final exam score, y, for a sample of college students in a general education course at a large state university. Complete parts (a) through (e) below. Click the icon to view the absence count and final exam score data. Click the icon to view a table of critical values for the correlation coefficient. (a) Find the least-squares regression line treating number of absences as the explanatory variable and the final exam score as the response variable. y =x + (Round to three decimal places as needed.) Absences and Final Exam Scores - X No. of absences, x 0 2 3 4 5 6 8 9 Final exam score, 89.8 86.8 83.3 81.5 77.4 73.4 64.9 72.6 64.8 65.4 Print Done Enter your answer in the edit fields and then click Check Answer, ? 6 P remaining Clear All Check Ans 16 0 10 11 prt sc delete home A 5 8 W E R T U O
Step by Step Solution
There are 3 Steps involved in it

Get step-by-step solutions from verified subject matter experts