

Question: Please I need help in solving these questions as soon as possible. It is math grade 12 academic. It is a qizmos https://www.explorelearning.com/index.cfm?method=cResource.dspDetail&ResourceID=504. This is
Please I need help in solving these questions as soon as possible. It is math grade 12 academic. It is a qizmos https://www.explorelearning.com/index.cfm?method=cResource.dspDetail&ResourceID=504. This is the link of it.
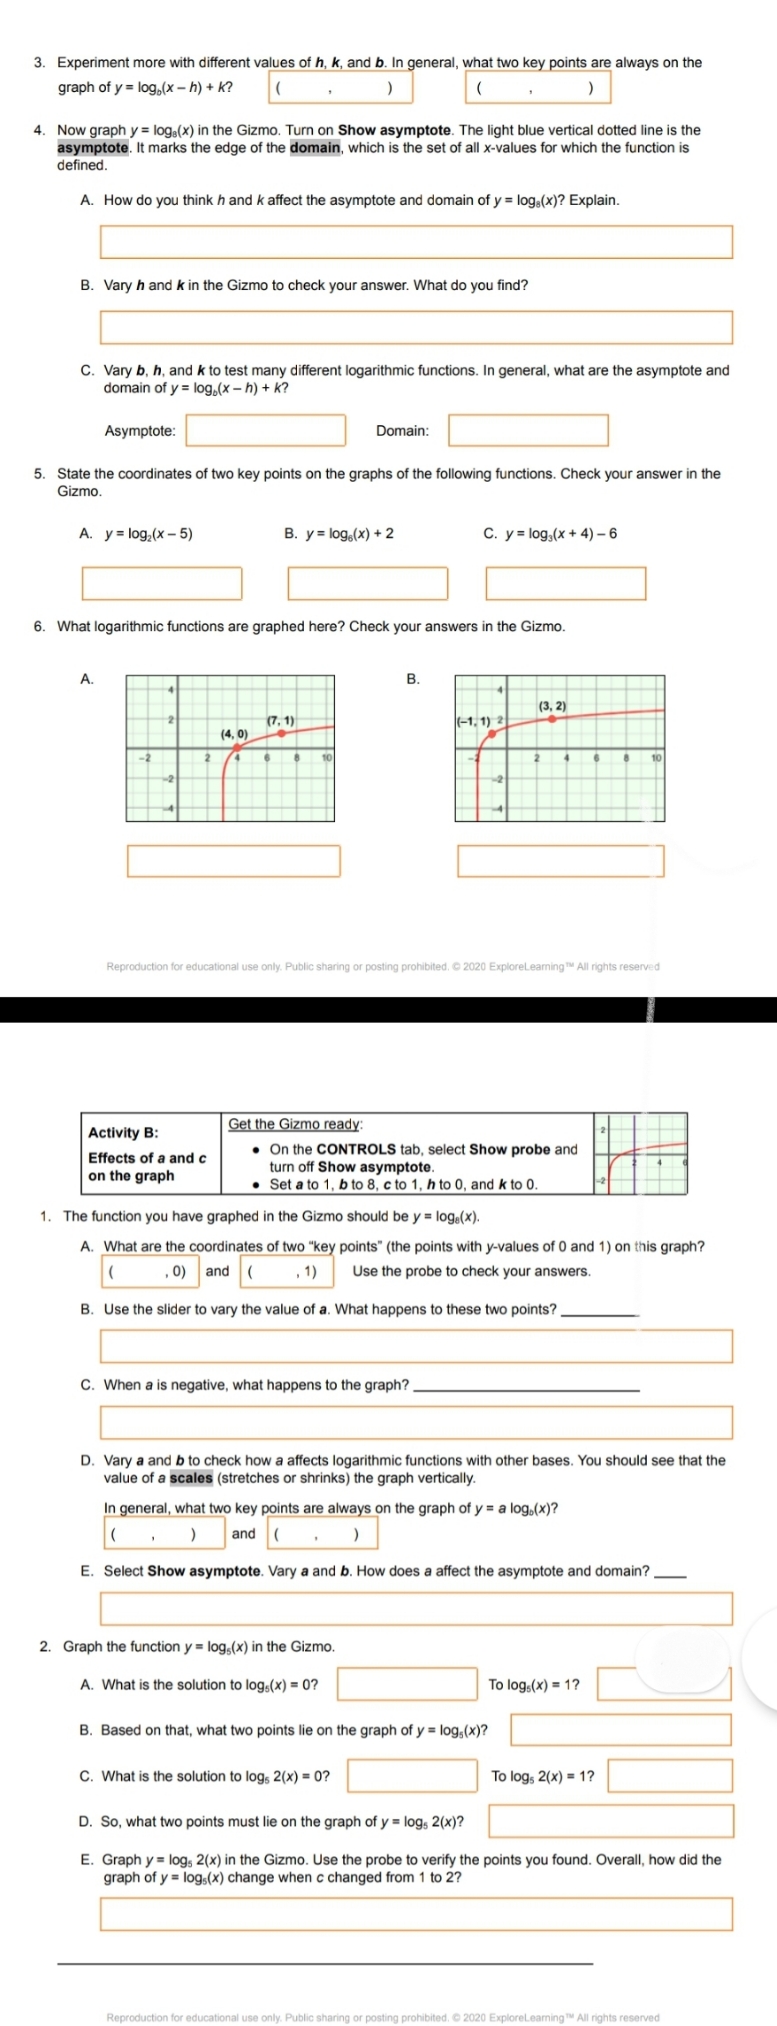
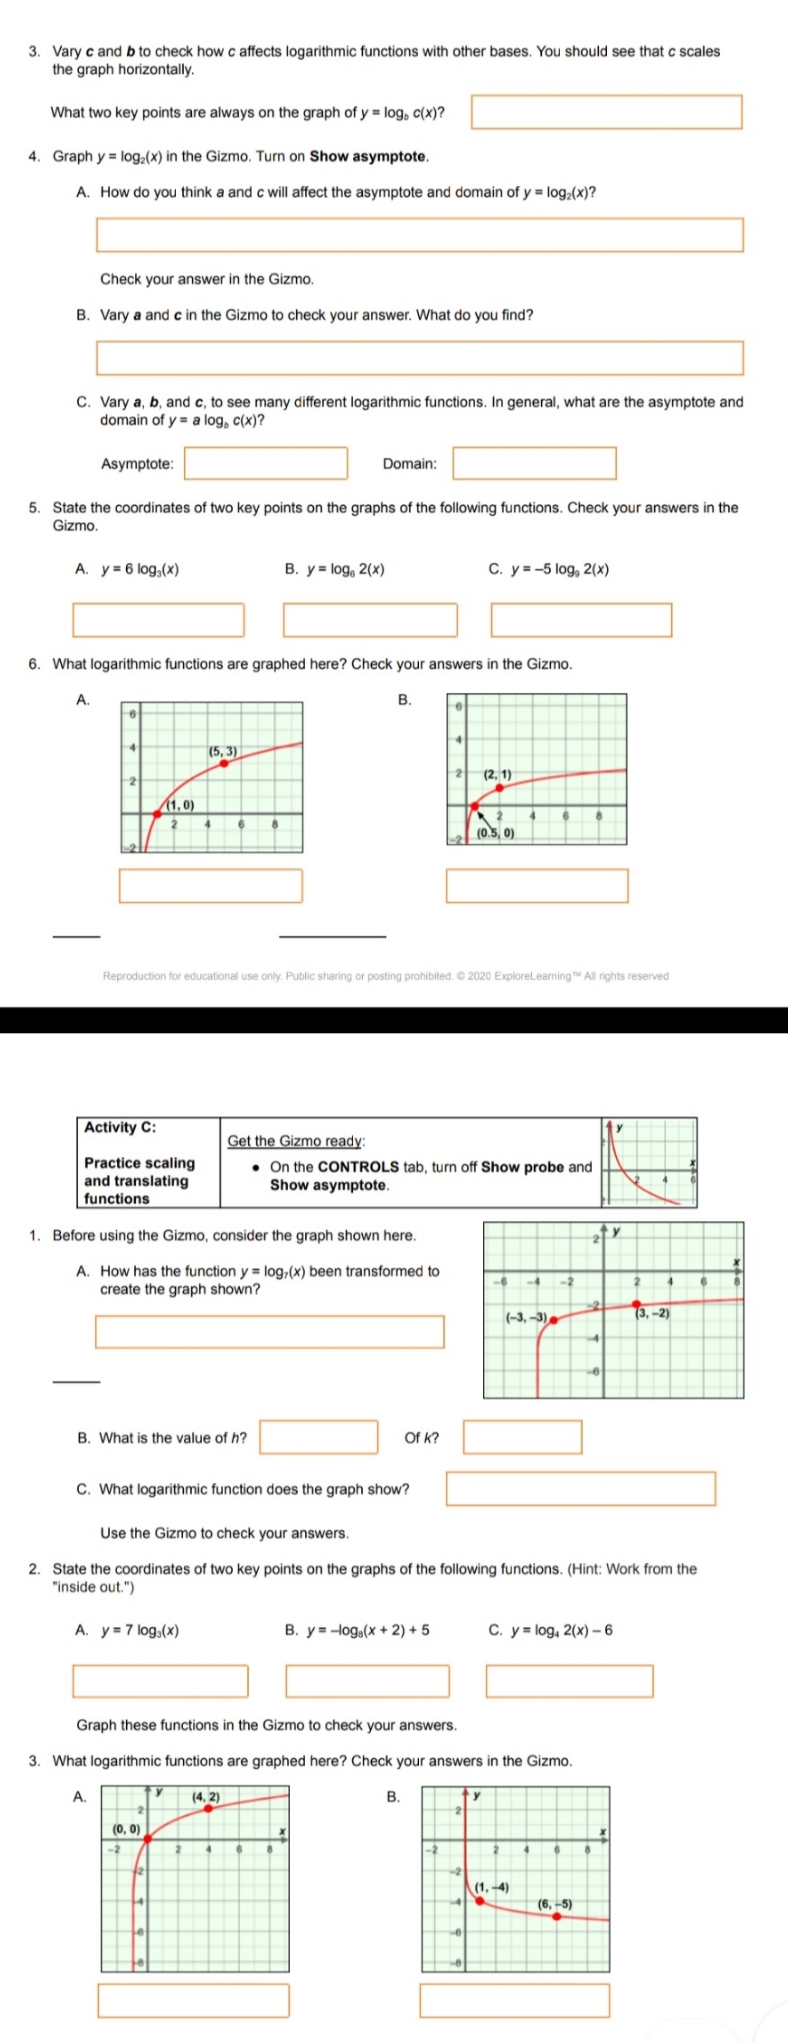
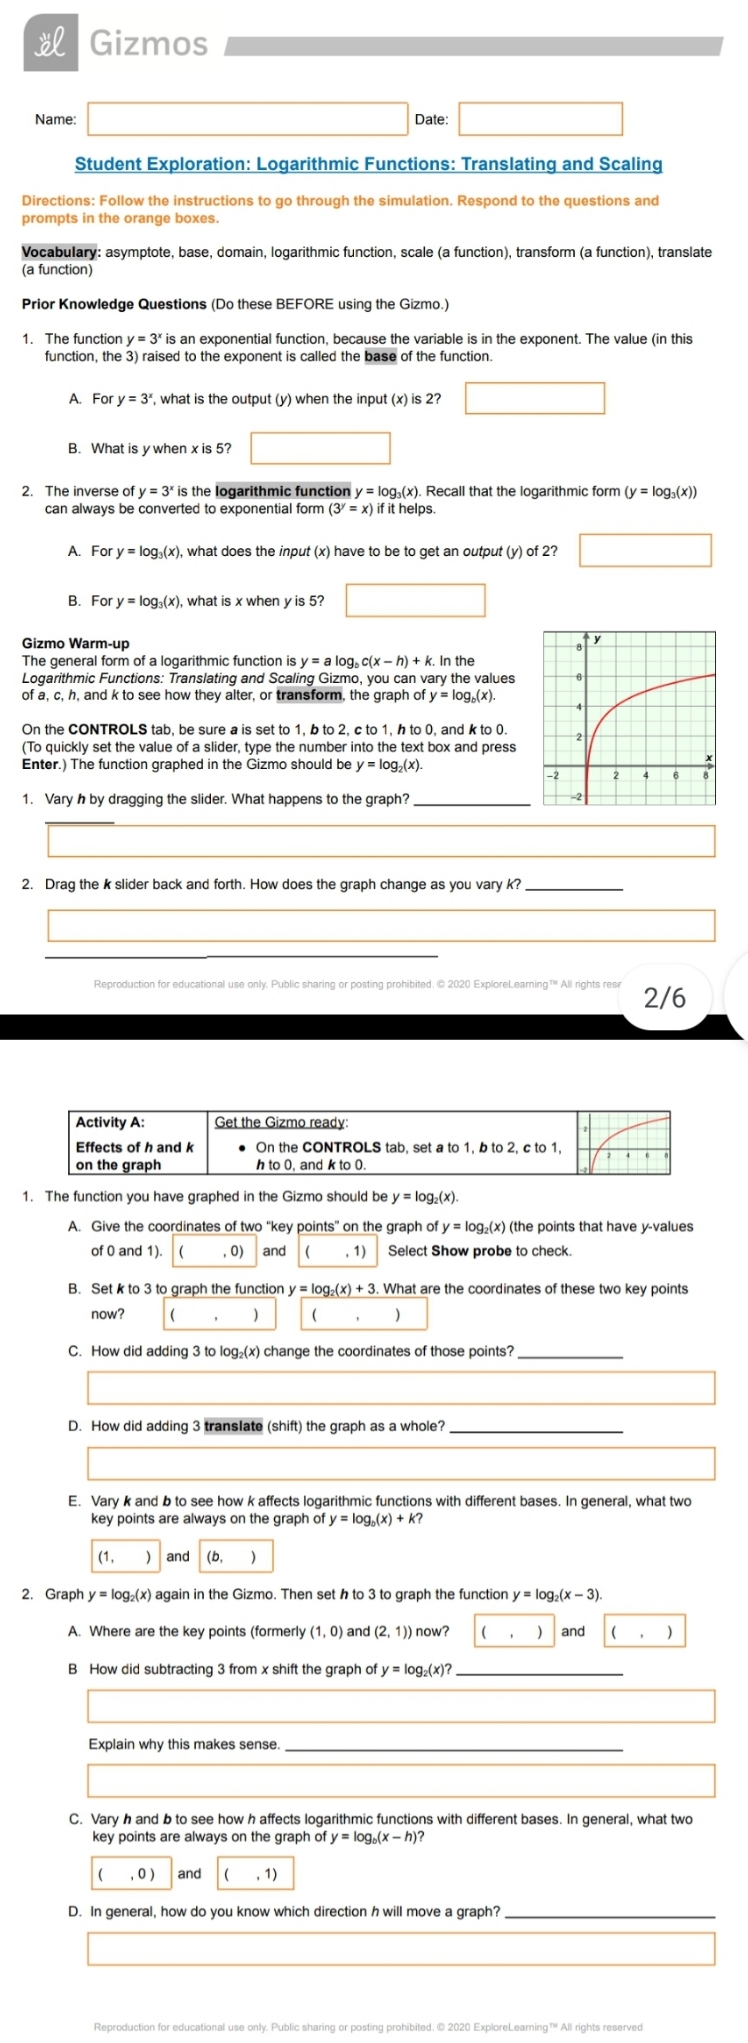
3. Experiment more with different values of h, k, and b. In general, what two key points are always on the graph of y = log,(x - h) + k? ( 4. Now graph y = log,(x) in the Gizmo. Turn on Show asymptote. The light blue vertical dotted line is the asymptote. It marks the edge of the domain, which is the set of all x-values for which the function is defined A. How do you think h and k affect the asymptote and domain of y = log,(x)? Explain. B. Vary h and k in the Gizmo to check your answer. What do you find? C. Vary b, h, and k to test many different logarithmic functions. In general, what are the asymptote and domain of y = log.(x - h) + k? Asymptote: Domain: 5. State the coordinates of two key points on the graphs of the following functions. Check your answer in the Gizmo A. y = log2(x - 5) B. y = log.(x) + 2 C. y = log,(x + 4) - 6 6. What logarithmic functions are graphed here? Check your answers in the Gizmo. B. (3, 2) (7. 1) (-1. 1) 2 (4, 0) Reproduction for education nal use only. Public sharing or posting prohibited. @ 2020 ExploreLearning TM All rights reserved Activity B: Get the Gizmo ready: Effects of a and c . On the CONTROLS tab, select Show probe and on the graph turn off Show asymptote. . Set a to 1, b to 8, c to 1, h to 0, and k to O 1. The function you have graphed in the Gizmo should be y = logs(x). A. What are the coordinates of two "key points" (the points with y-values of 0 and 1) on this graph? , 0) and ( , 1) Use the probe to check your answers. B. Use the slider to vary the value of a. What happens to these two points? C. When a is negative, what happens to the graph? D. Vary a and b to check how a affects logarithmic functions with other bases. You should see that the value of a scales (stretches or shrinks) the graph vertically. In general, what two key points are always on the graph of y = a log.(x)? ( ) and ( E. Select Show asymptote. Vary a and b. How does a affect the asymptote and domain? 2. Graph the function y = log,(x) in the Gizmo. A. What is the solution to log,(x) = 0? To log,(x) = 1? B. Based on that, what two points lie on the graph of y = log,(x)? C. What is the solution to logs 2(x) = 0? To logs 2(x) = 1? D. So, what two points must lie on the graph of y = logs 2(x)? E. Graph y = log, 2(x) in the Gizmo. Use the probe to verify the points you found. Overall, how did the graph of y = logs(x) change when c changed from 1 to 2?3. Vary c and b to check how c affects logarithmic functions with other bases. You should see that c scales the graph horizontally. What two key points are always on the graph of y = log, c(x)? 4. Graph y = log2(x) in the Gizmo. Turn on Show asymptote. A. How do you think a and c will affect the asymptote and domain of y = log2(x)? Check your answer in the Gizmo. B. Vary a and c in the Gizmo to check your answer. What do you find? C. Vary a, b, and c, to see many different logarithmic functions. In general, what are the asymptote and domain of y = a log, c(x)? Asymptote: Domain: 5. State the coordinates of two key points on the graphs of the following functions. Check your answers in the Gizmo. A. y = 6 log,(x) B. y = log6 2(x) C. y = -5 log, 2(x) 6. What logarithmic functions are graphed here? Check your answers in the Gizmo. (5, 3) 2 2 (2, 1) (1, 0) (0.5 0) Reproduction for educational use only. Public sharing or posting prohibited. @ 2020 ExploreLearning " All rights reserved Activity C: Get the Gizmo ready: Practice scaling . On the CONTROLS tab, turn off Show probe and and translating Show asymptote functions 1. Before using the Gizmo, consider the graph shown here. A. How has the function y = log,(x) been transformed to create the graph shown? ( -3, -3). (3, -2) B. What is the value of h? Of K ? C. What logarithmic function does the graph show? Use the Gizmo to check your answers. State the coordinates of two key points on the graphs of the following functions. (Hint: Work from the "inside out.") A. y = 7 logs(x) B. y = -log.(x + 2) + 5 C. y = log, 2(x) - 6 Graph these functions in the Gizmo to check your answers. 3. What logarithmic functions are graphed here? Check your answers in the Gizmo. A. (4, 2) (0, 0 (1. -4) (6, -5)Gizmos Name: Date Student Exploration: Logarithmic Functions: Translating and Scaling Directions: Follow the instructions to go through the simulation. Respond to the questions and prompts in the orange boxes. Vocabulary: asymptote, base, domain, logarithmic function, scale (a function), transform (a function), translate (a function) Prior Knowledge Questions (Do these BEFORE using the Gizmo.) 1. The function y = 3" is an exponential function, because the variable is in the exponent. The value (in this function, the 3) raised to the exponent is called the base of the function. A. For y = 3", what is the output (y) when the input (x) is 2? B. What is y when x is 5? 2. The inverse of y = 3" is the logarithmic function y = log,(x). Recall that the logarithmic form (y = log,(x)) can always be converted to exponential form (3 = x) if it helps. A. For y = log;(x), what does the input (x) have to be to get an output (y) of 2? B. For y = log;(x), what is x when y is 5? Gizmo Warm-up The general form of a logarithmic function is y = a log, c(x - h) + k. In the Logarithmic Functions: Translating and Scaling Gizmo, you can vary the values of a, c, h, and k to see how they alter, or transform, the graph of y = log,(x). On the CONTROLS tab, be sure a is set to 1, b to 2, c to 1, h to 0, and k to 0. To quickly set the value of a slider, type the number into the text box and press Enter.) The function graphed in the Gizmo should be y = log2(x). 1. Vary h by dragging the slider. What happens to the graph? 2. Drag the k slider back and forth. How does the graph change as you vary k? ad. @ 2020 ExploreLearning TM All rights res 2/6 Activity A: Get the Gizmo ready: Effects of h and k On the CONTROLS tab, set a to 1, b to 2, c to 1, on the graph h to 0, and k to 0. 1. The function you have graphed in the Gizmo should be y = logz(x). A. Give the coordinates of two "key points" on the graph of y = log2(x) (the points that have y-values of 0 and 1). ( ,0) and ( , 1) Select Show probe to check B. Set k to 3 to graph the function y = log,(x) + 3. What are the coordinates of these two key points now? ") . ) C. How did adding 3 to log2(x) change the coordinates of those points? D. How did adding 3 translate (shift) the graph as a whole? E. Vary k and b to see how k affects logarithmic functions with different bases. In general, what two key points are always on the graph of y = log.(x) + k? (1, ) and (b, 2. Graph y = log2(x) again in the Gizmo. Then set h to 3 to graph the function y = log2(x - 3) A. Where are the key points (formerly (1, 0) and (2, 1)) now? ( . ) and ( . ) B How did subtracting 3 from x shift the graph of y = log2(x)? Explain why this makes sense. C. Vary h and b to see how h affects logarithmic functions with different bases. In general, what two key points are always on the graph of y = log.(x - h)? ( ,0) and ( , 1 ) D. In general, how do you know which direction h will move a graph? Reproduction for educational aring or posting prohibited. @ 2020 ExploreLearning TM All rights reserved
Step by Step Solution
There are 3 Steps involved in it

Get step-by-step solutions from verified subject matter experts