

Question: please i need help in this question for my micro Question 1 [42 points] Use the following demand schedule and cost information to determine the
please i need help in this question for my micro
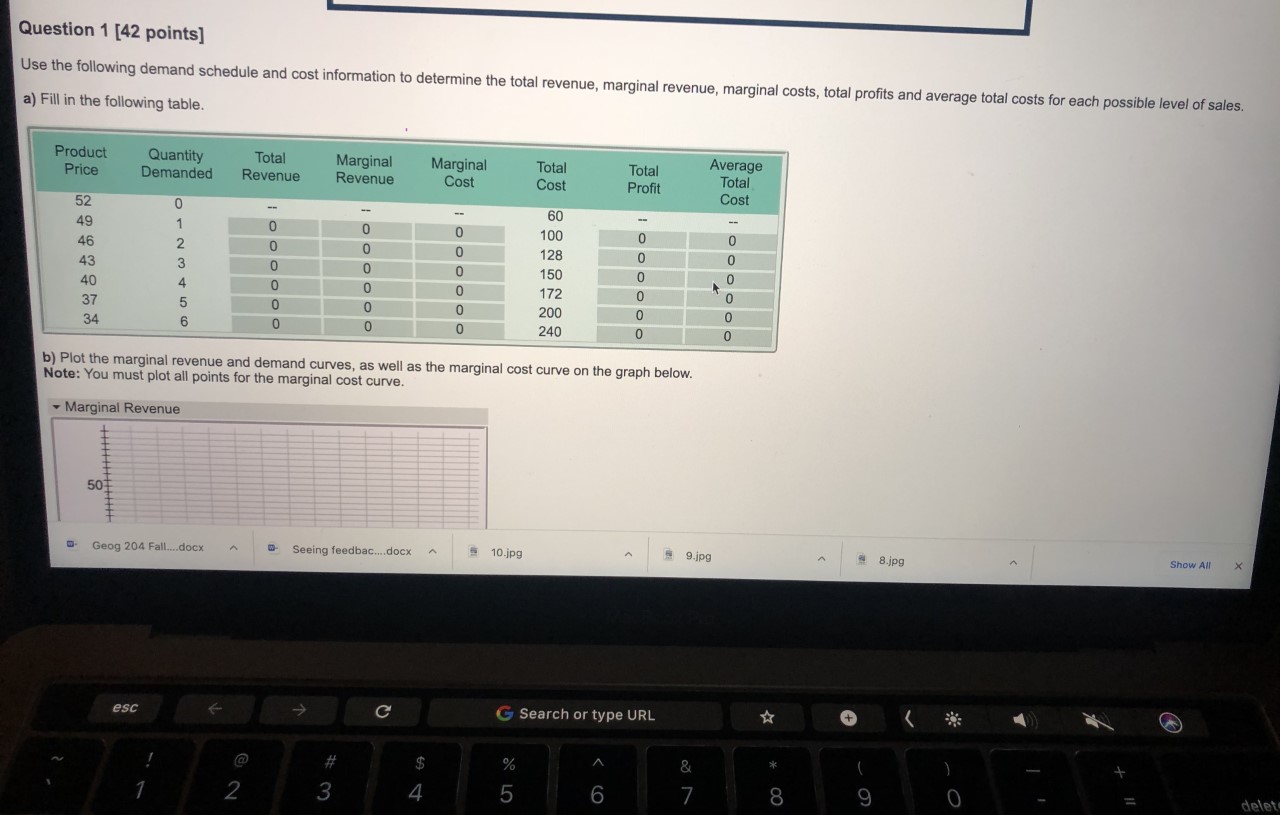
Question 1 [42 points] Use the following demand schedule and cost information to determine the total revenue, marginal revenue, marginal costs, total profits and average total costs for each possible level of sales. a) Fill in the following table. Product Quantity Total Marginal Marginal Total Total Average Price Demanded Revenue Revenue Cost Cost Profit Total Cost 52 60 49 O 100 0 46 0 128 0 0 43 0 150 0 0 DOAWN- oooo oooo 40 0 172 0 0 37 200 O 0 34 0 0 0 240 0 0 b) Plot the marginal revenue and demand curves, as well as the marginal cost curve on the graph below. Note: You must plot all points for the marginal cost curve. Marginal Revenue Show All X 9.ipg A 8.jpg Geog 204 Fall....docx Seeing feedback...docx 10.jpg A G Search or type URL + esc @ $ 5 8 9 O 2
Step by Step Solution
There are 3 Steps involved in it

Get step-by-step solutions from verified subject matter experts